
Executive Summary
ROCm 7 turns every existing MI300X node into a higher-capacity node. On the same Dell PowerEdge XE9680 servers, ROCm 7 delivers approximately 1.3x more throughput at production load and up to 2.2x more at high concurrency, with no new GPUs, no new racks, and no new power circuits.
In head-to-head benchmarks running Qwen3-30B-A3B on Dell PowerEdge XE9680 servers, ROCm 7 (vLLM 0.14.0) delivers up to 1.54x higher throughput at production concurrency and up to 2.2x at high concurrency compared to ROCm 6.3.1 (vLLM 0.8.5) on the same MI300X hardware. The gains are zero-cost: no new GPUs, no rack space changes. No model changes or retraining required - the same weights run on ROCm 7 for higher throughput.
Key Results at a Glance
Up to 1.54x throughput at production concurrency Short Q&A: 20,115 to 31,024 TPS at 1,024 concurrent requests |
Up to 2.2x throughput at high concurrency Report generation: 28,426 to 62,674 TPS at 8,192 concurrent requests |
Zero hardware changes required Same MI300X GPUs, same Dell PowerEdge servers, same rack footprint |
Continuous Scaling on ROCm 7 ROCm 6 stalls at 2,048-4,096 concurrency; ROCm 7 continues to 8,192 |
These gains come without increasing error rates. Both stacks remain effectively error-free through realistic concurrency levels.
Why Software-Defined Performance Matters Now
Enterprise data center hardware refresh cycles typically run three to five years.[1] Organizations that deployed MI300X infrastructure in 2024 or 2025 are one to two years into that cycle. For these teams, the question is not whether to buy new hardware. It is how to extract more value from the hardware already installed.
The utilization gap: existing MI300X nodes are underused as AI traffic grows. Most MI300X deployments were sized for expected peak demand. As AI inference workloads grow, concurrency requirements increase. Concurrency is simply how many user requests a node handles at the same time. A software upgrade that extends throughput at high concurrency directly delays or eliminates the need for hardware expansion.
The scaling wall: older software stacks stop scaling at high concurrency. Inference serving engines and GPU runtime stacks have improved rapidly. ROCm 6 was optimized for the workloads and concurrency patterns of early 2025. ROCm 7 includes lower-level GPU software optimizations that let the same hardware handle significantly more simultaneous requests.
Deployment simplicity: A software upgrade carries none of the capital, power, or facility costs of a hardware expansion. It requires no new procurement approvals, no rack reconfiguration, and no cooling capacity changes. Teams can validate the upgrade in a staging environment and roll it out during a standard maintenance window.
Benchmark Configuration
All benchmarks compare two software configurations on identical MI300X hardware. This isolates the software contribution from any hardware differences.
| Parameter | Value |
|---|---|
| Model | Qwen3-30B-A3B-Thinking-2507 |
| GPU | 8x AMD Instinct MI300X (192 GB HBM3 per GPU) |
| System | Dell PowerEdge XE9680 |
| ROCm 6 Config | ROCm 6.3.1, vLLM 0.8.5 |
| ROCm 7 Config | ROCm 7.0, vLLM 0.14.0 |
| Concurrency Sweep | 1 to 8,192 concurrent requests |
| Metrics | Tokens per second (TPS, a standard measure of LLM throughput), total system power (W), error rate |
Four scenarios map to common enterprise inference patterns:
| Scenario | Input / Output Tokens | Enterprise Use Case |
|---|---|---|
| Short Q&A | 128 in / 128 out | Real-time scoring, classification, chatbot |
| Report Generation | 128 in / 2,048 out | Report generation, regulatory summaries |
| RAG / Document Q&A | 2,048 in / 128 out | Contract analysis, earnings Q&A, RAG |
| Deep Research | 2,048 in / 2,048 out | Long-form synthesis, deep research |
Performance Results
Throughput at Production Concurrency
At a realistic production load of 1,024 concurrent requests, ROCm 7 delivers about 34% more throughput on average on the same MI300X hardware.At 1,024 concurrent requests, a concurrency level representative of departmental and enterprise deployments, ROCm 7 delivers consistent gains across all four workload profiles.
| Scenario | ROCm 6 TPS | ROCm 7 TPS | Throughput Gain |
|---|---|---|---|
| 128 in / 128 out | 20,115 | 31,024 | 1.54x |
| 128 in / 2,048 out | 21,066 | 27,230 | 1.29x |
| 2,048 in / 128 out | 9,684 | 13,270 | 1.37x |
| 2,048 in / 2,048 out | 18,016 | 20,970 | 1.16x |
Table 1 - Throughput at 1,024 Concurrent Requests. All results zero-error on both stacks.
The short Q&A workload shows the strongest gain at 1.54x. This workload is latency-sensitive and compute-bound, where ROCm 7's kernel optimizations have the most direct impact. The long-context, long-output scenario (2,048/2,048) shows a more modest 1.16x, reflecting workloads that are more memory-bandwidth-bound.
Averaged across all four scenarios at 1,024 concurrency, ROCm 7 delivers 1.34x the throughput of ROCm 6 on the same hardware. That is a 34% throughput increase from a software upgrade alone.
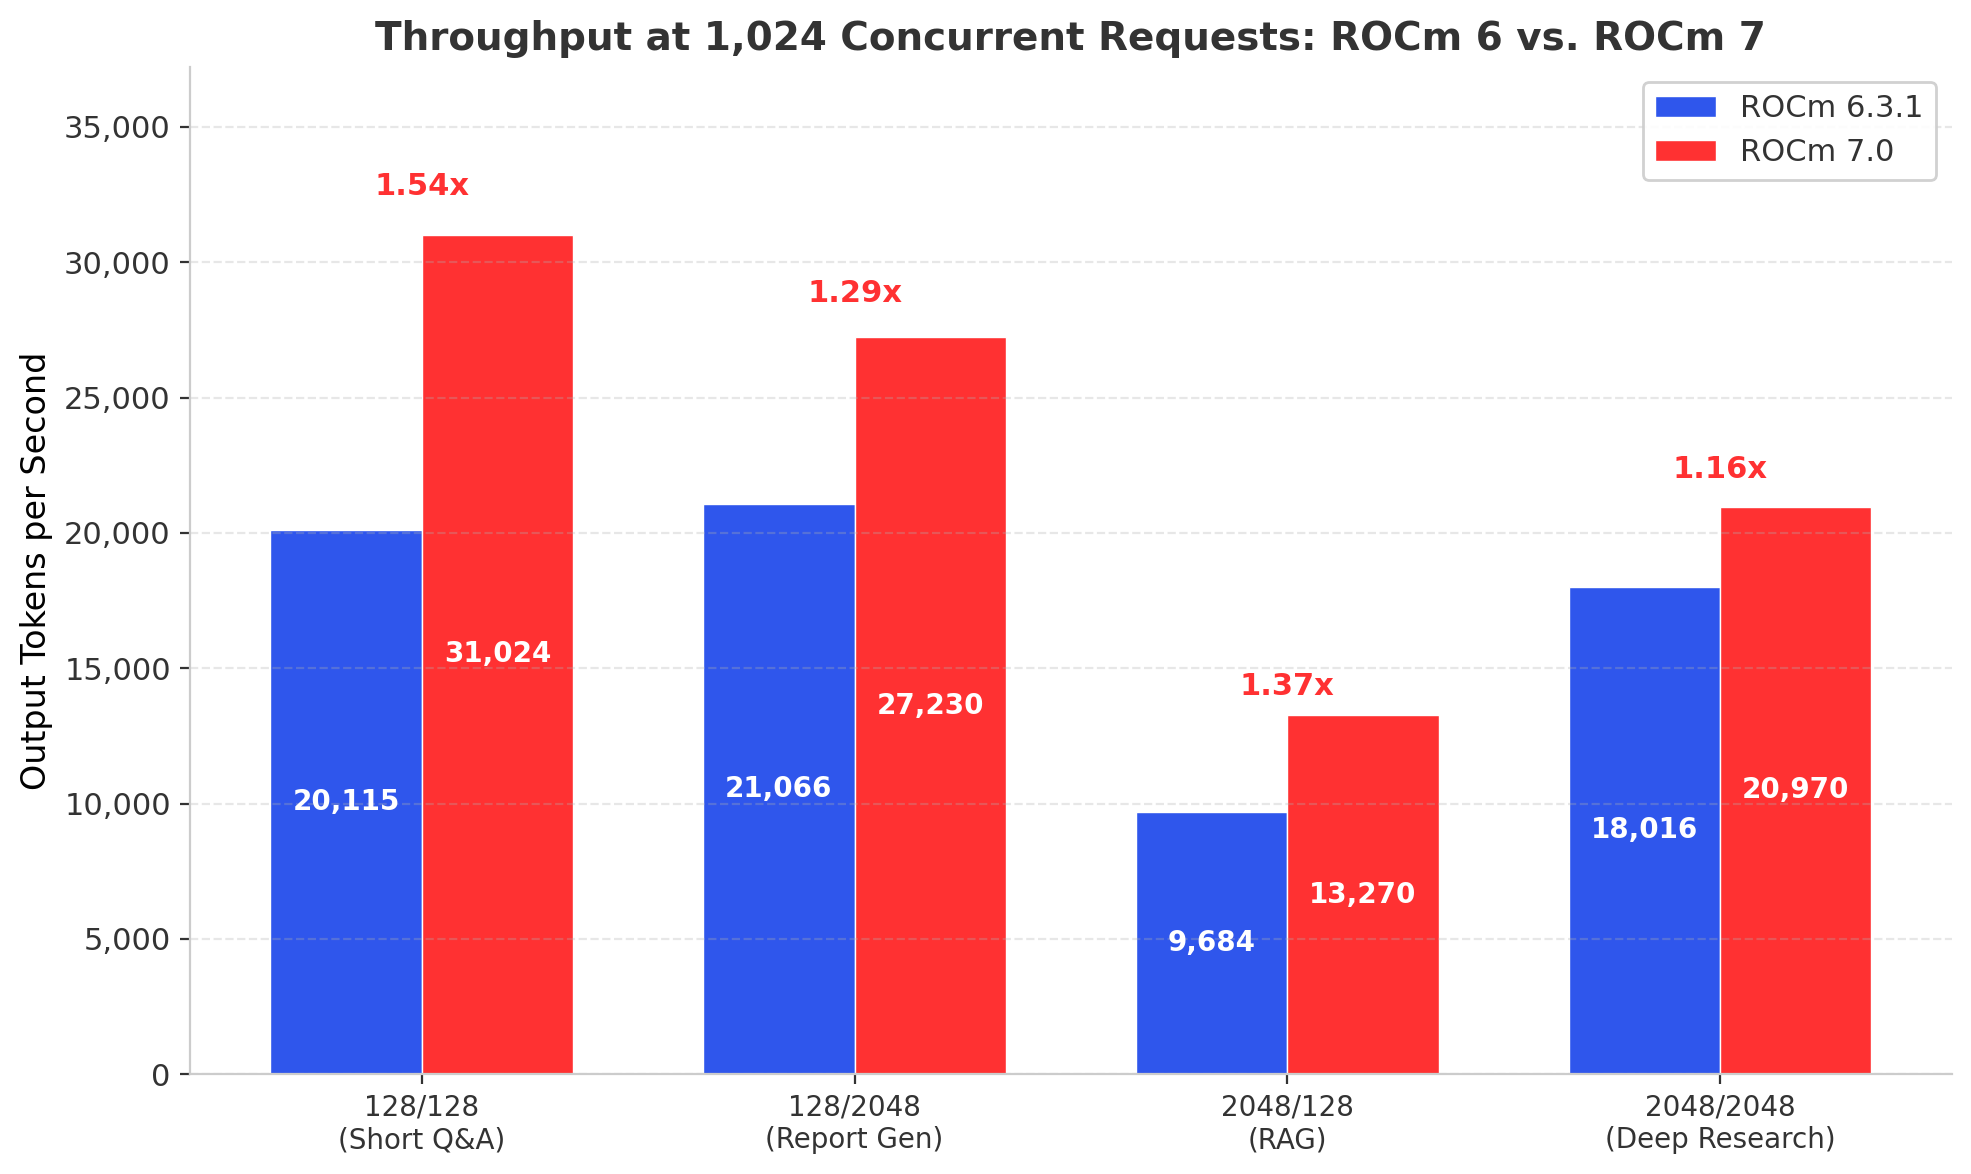
Figure 1 - Throughput at 1,024 Concurrent Requests Across All Workload Profiles
Where ROCm 7 Pulls Away: The Scaling Ceiling
Above 2,048 concurrent requests, ROCm 6 effectively stops scaling while ROCm 7 keeps going, reaching 2.2x higher throughput at 8,192 requests in report-generation workloads.The throughput comparison at 1,024 concurrency tells only part of the story. The more consequential difference emerges at higher concurrency, where ROCm 6 stops scaling and ROCm 7 continues.
| Scenario | Concurrency | ROCm 6 TPS | ROCm 7 TPS | Gain |
|---|---|---|---|---|
| 128 in / 128 out | 2,048 | 28,841 | 45,424 | 1.58x |
| 128 in / 128 out | 4,096 | 31,712 | 53,653 | 1.69x |
| 128 in / 2,048 out | 2,048 | 29,193 | 42,222 | 1.45x |
| 128 in / 2,048 out | 4,096 | 28,902* | 50,474 | 1.75x |
| 128 in / 2,048 out | 8,192 | 28,426* | 62,674 | 2.20x |
| 2,048 in / 128 out | 4,096 | 11,554 | 18,251 | 1.58x |
| 2,048 in / 2,048 out | 2,048 | 23,498 | 29,763 | 1.27x |
| 2,048 in / 2,048 out | 4,096 | 23,500 | 36,038 | 1.53x |
Table 2 - Throughput at High Concurrency. *ROCm 6 throughput declining (plateau reached). All results zero-error.
The pattern is consistent across workloads. ROCm 6 throughput growth slows sharply above 2,048 concurrent requests and effectively stalls by 4,096. In the report generation scenario (128/2048), ROCm 6 throughput actually declines from 29,193 TPS at 2,048 concurrency to 28,426 TPS at 8,192, a regression under load.
ROCm 7, by contrast, continues scaling. At 4,096 concurrency, the average gain across all scenarios reaches 1.64x. For the report generation workload at 8,192 concurrent requests, ROCm 7 delivers 62,674 TPS where ROCm 6 manages only 28,426, a 2.2x improvement.
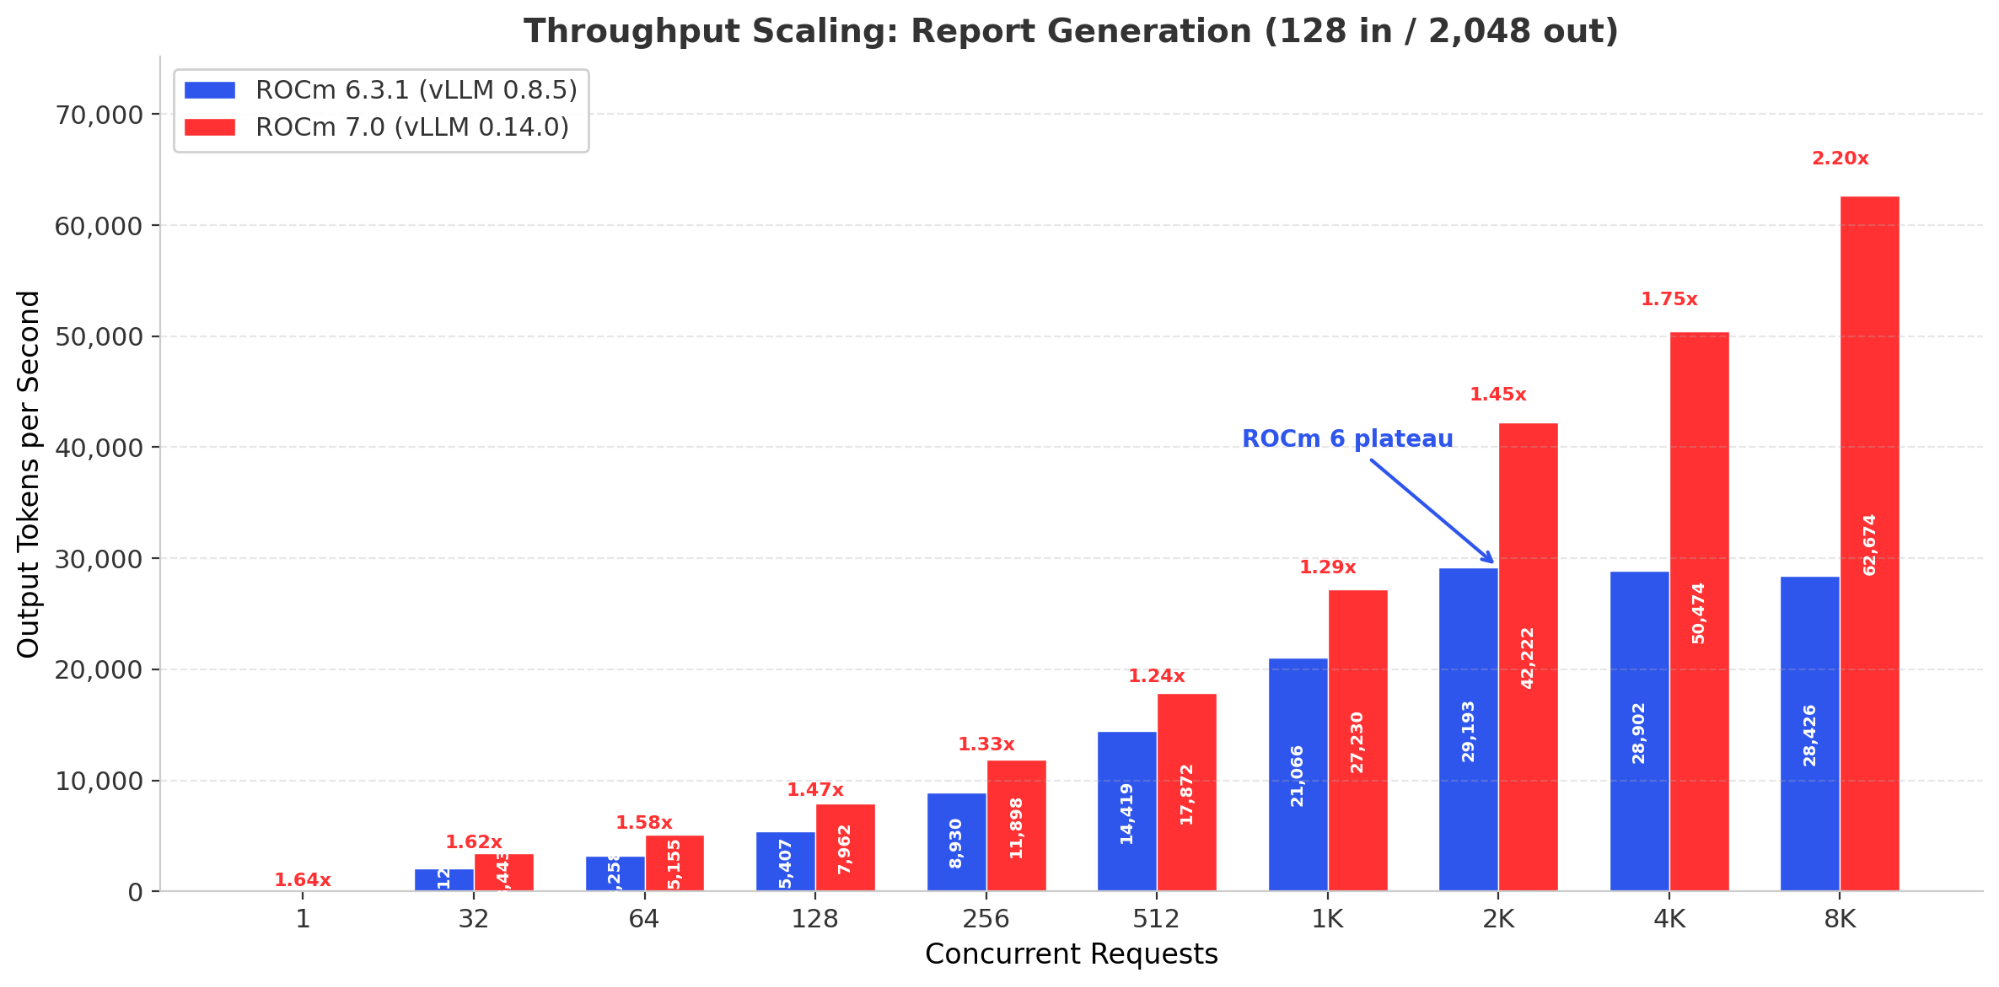
Figure 2 - Report Generation Throughput Scaling. ROCm 6 plateaus at 2,048 concurrency; ROCm 7 continues to 62,674 TPS at 8,192.
For capacity planners, this is the critical finding. ROCm 7 does not just run faster at today's concurrency levels. It extends the usable concurrency range of the MI300X, allowing each node to absorb more traffic before requiring additional hardware.
Full Concurrency Sweep: Short Q&A (128 in / 128 out)
The short Q&A workload provides the clearest view of the scaling difference. Figure 3 shows throughput at every tested concurrency level.
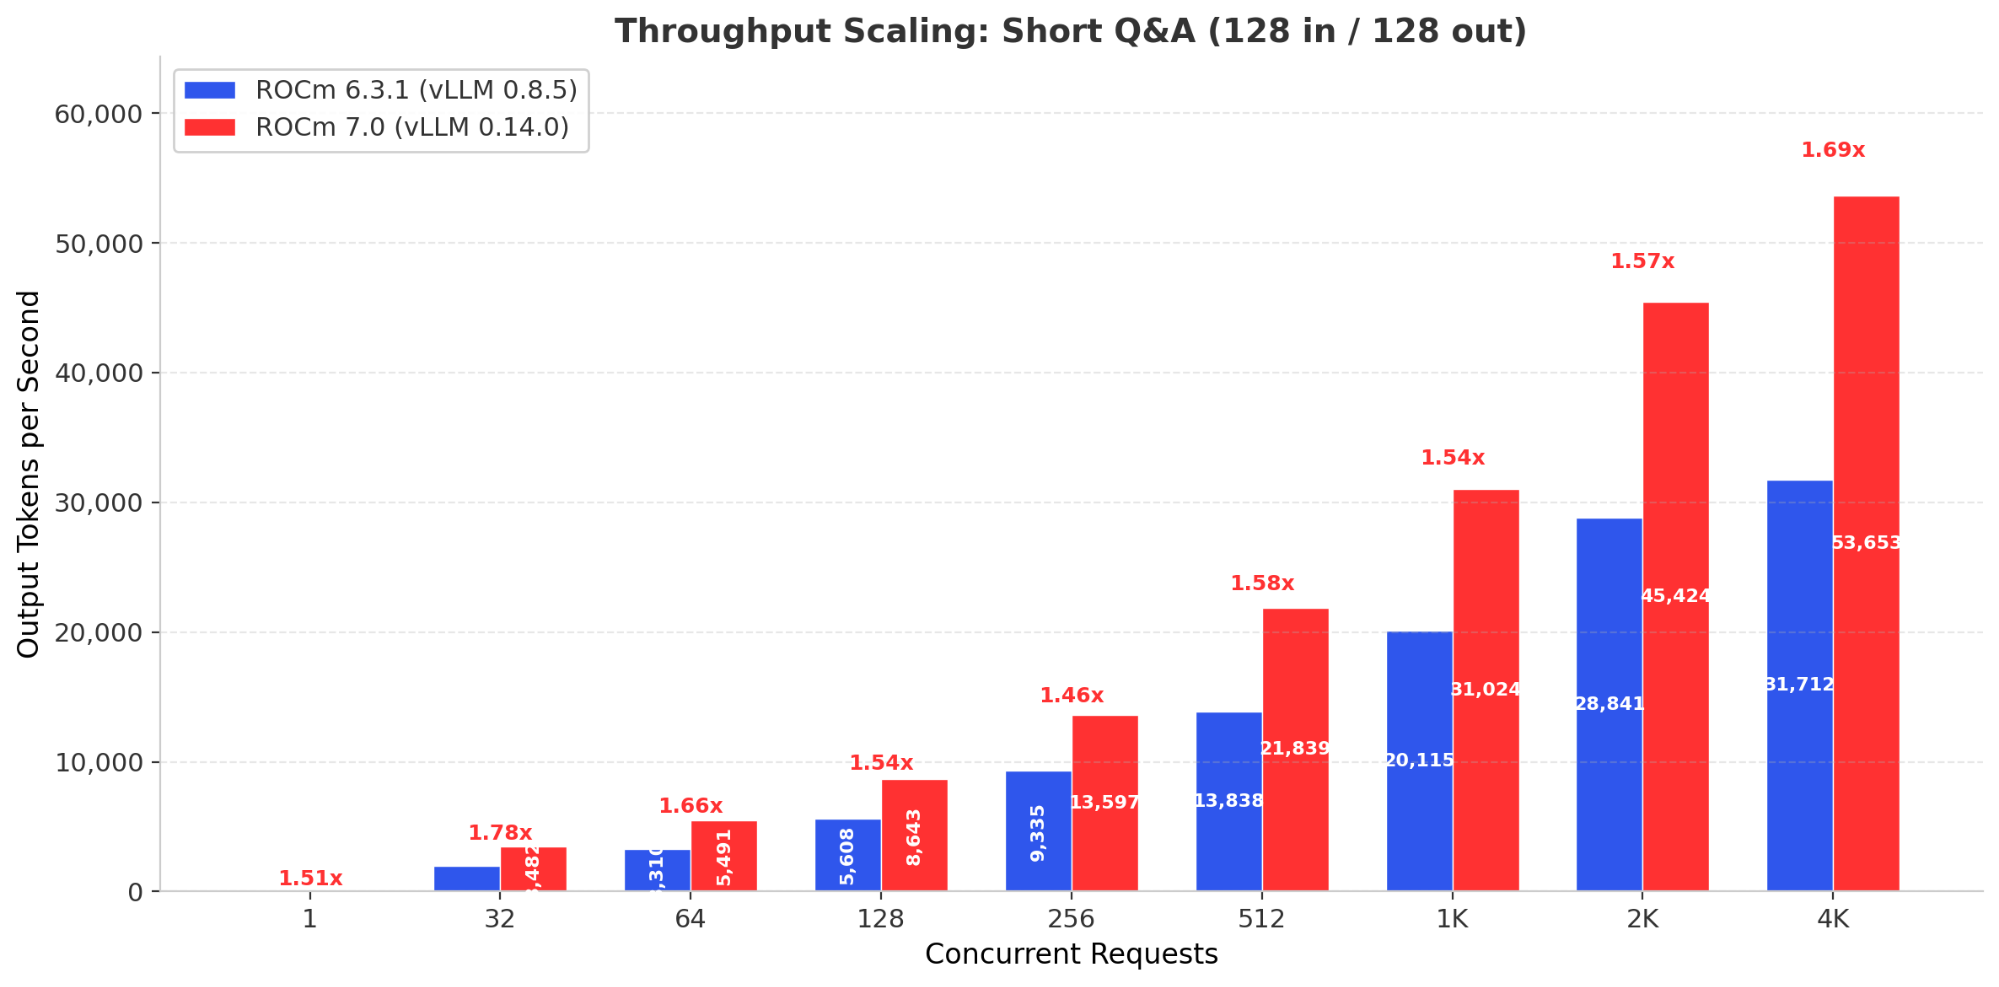
Figure 3 - Short Q&A Throughput Scaling: ROCm 7 leads at every concurrency level with widening advantage.
Two patterns stand out. First, ROCm 7 leads at every concurrency level, from single-request inference (1.50x) through production scale (1.54x at 1,024) to high concurrency (1.69x at 4,096). Second, ROCm 6 throughput growth drops to under 2% between 4,096 and 8,192 concurrent requests. ROCm 7 still shows 31% growth in that same range before encountering errors.
The following chart illustrates this pattern across all four workloads. The throughput ratio between ROCm 7 and ROCm 6 dips at mid-range concurrency (where both stacks scale well) and then rises sharply above 2,048 concurrent requests as ROCm 6 hits its ceiling.
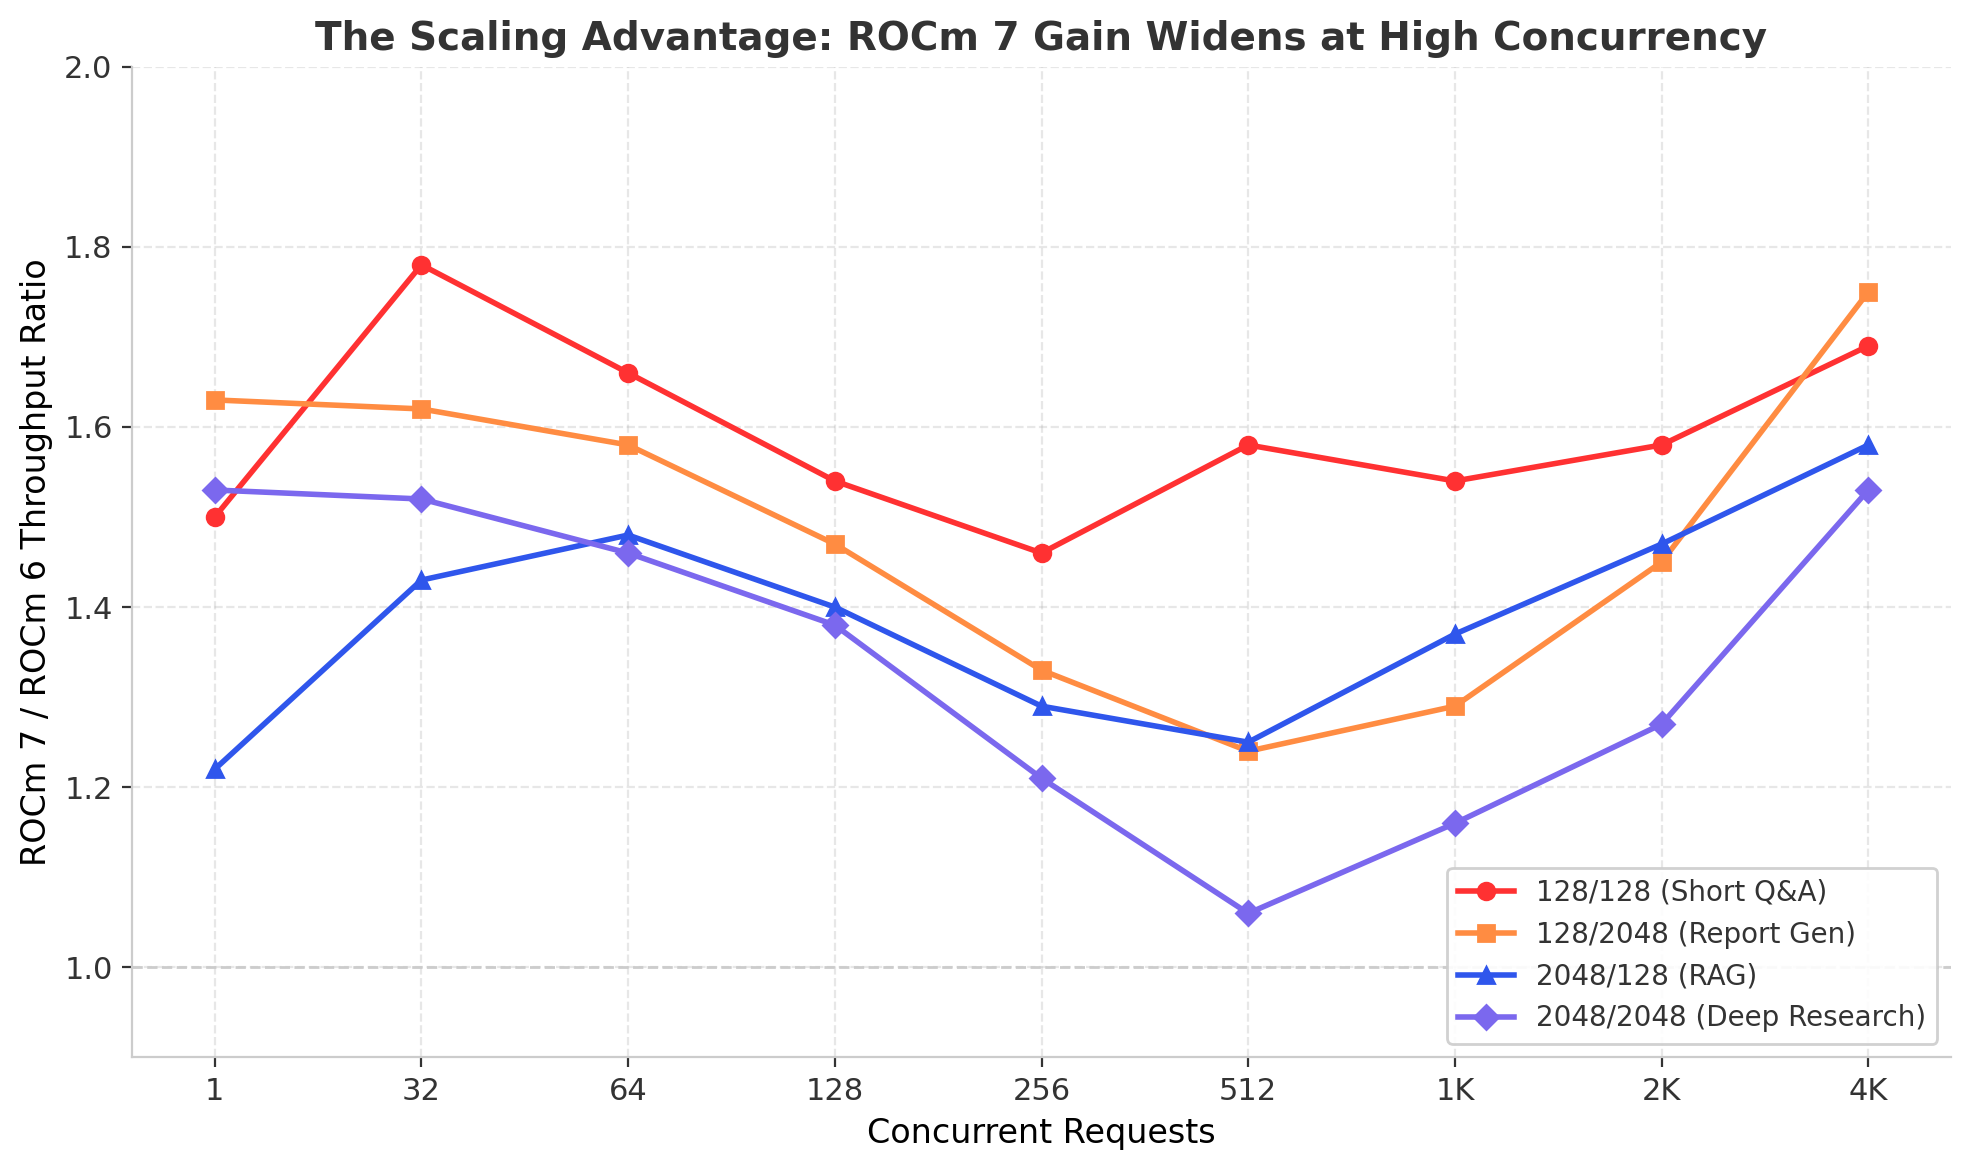
Figure 4 - The Scaling Advantage: ROCm 7 throughput gain ratio increases at high concurrency across all workloads.
Reliability at Scale
Both software stacks maintain zero error rates through most of the concurrency range. Errors appear only at the extreme upper end (8,192 concurrent requests) and remain below 1% for both stacks across all scenarios.
A Note on Power Consumption
ROCm 7 generally draws moderately higher system power than ROCm 6 at the same concurrency level. At 1,024 concurrent requests, ROCm 7 power ranges from 6,370W to 9,797W across scenarios, compared to 6,631W to 7,799W on ROCm 6.
This increase reflects ROCm 7's more aggressive utilization of available compute resources. The GPU is doing more useful work per unit time, which directly increases power draw. The throughput gains outpace the power increase in most scenarios, but the primary value is higher throughput per node. For many workloads, ROCm 7 also improves throughput-per-watt, as shown in Table 3; for long-context workloads, the main benefit is throughput, not efficiency. The relevant question is how much more output they can extract within that existing envelope.
| Scenario | ROCm 6 TPS/W | ROCm 7 TPS/W | Efficiency Delta |
|---|---|---|---|
| 128 in / 128 out | 3.03 | 4.87 | +61% |
| 128 in / 2,048 out | 2.79 | 2.80 | +0.5% |
| 2,048 in / 128 out | 1.27 | 1.71 | +35% |
| 2,048 in / 2,048 out | 2.31 | 2.14 | -7% |
Table 3 - Performance-per-Watt at 1,024 Concurrency. TPS/W = tokens per second / total system power (watts), measured at the node level via iDRAC.
For compute-bound workloads (short Q&A, RAG), ROCm 7 improves both throughput and efficiency. For memory-bandwidth-bound workloads (2,048/2,048), the efficiency trade-off is roughly neutral. In all cases, the total tokens-per-node improvement is the primary value driver.
What This Means for Your MI300X Fleet
The benchmark data supports three concrete infrastructure planning conclusions.
Defer hardware expansion. ROCm 7 stretches your MI300X throughput ceiling by 1.3x to 2.2x, often buying six to twelve months before you need additional nodes, networking, or facility investment.
Absorb AI traffic growth. A 34% average throughput increase at 1,024 concurrency can match a full year of 20-40%[2] demand growth on the same footprint, with no new hardware.
Handle peak spikes. A higher scaling ceiling at 4,096 and above concurrent requests means fewer queue buildups and more predictable SLAs during peak hours, especially for shared inference services consolidating multiple applications onto a single GPU cluster.
The Upgrade Path
ROCm 7 supports the same MI300X hardware that ran ROCm 6. The upgrade path does not require hardware changes, BIOS updates specific to ROCm 7, or re-architecture of inference serving configurations.
Step 1: Validate in staging. Deploy the ROCm 7 container (rocm/vllm:rocm7.0 or equivalent) on a non-production MI300X node. Run your production workload mix at representative concurrency levels to confirm throughput improvements and validate model output quality.
Step 2: Monitor with Dell iDRAC. Use Dell iDRAC telemetry to compare power draw, GPU temperature, and memory utilization between ROCm 6 and ROCm 7 under load. The data in this paper shows moderately higher power consumption on ROCm 7. Confirm that your cooling infrastructure accommodates the increase at your specific concurrency levels.
Step 3: Roll out during maintenance. Swap the serving container image from the ROCm 6 build to ROCm 7 during a standard maintenance window. The model weights, serving configuration, and client interfaces remain unchanged.
Organizations using Dell Enterprise Hub on Hugging Face can pull pre-validated ROCm 7 containers tested on Dell PowerEdge platforms with AMD Instinct accelerators, reducing the validation effort further.
Looking Ahead: ROCm 7 on MI355X
The gains documented in this paper apply to existing MI300X hardware. For organizations planning new deployments or hardware refreshes, ROCm 7 is also the foundation software stack for the AMD Instinct MI355X (CDNA 4). The MI355X delivers generational improvements in memory capacity (288 GB HBM3e per GPU), bandwidth (8 TB/s), and native FP4 compute. Combined with ROCm 7's software optimizations, the MI355X achieves <
ROCm 7 ensures that organizations investing in AMD Instinct today build on a software foundation that carries forward. The kernels, memory management improvements, and scheduling optimizations developed for ROCm 7 on MI300X directly benefit MI355X deployments, providing software continuity across hardware generations.
Conclusion: More Tokens from Every Dollar Already Spent
ROCm 7 delivers, on average, 34% more throughput at production load and up to 2.2x more at high concurrency on the same MI300X hardware, with no new GPUs, no new racks, and no new power circuits required. These gains come without increasing error rates.
Organizations upgrade their software stack and immediately serve more users, process more tokens, and absorb more growth on hardware they have already purchased, racked, and cooled.
For infrastructure teams managing AMD Instinct fleets, the ROCm 7 upgrade is the highest-ROI action available today. ROCm 7 turns every existing MI300X node into a higher-capacity node.
Learn more about AMD Instinct MI355X at amd.com/instinct
References
[1] Uptime Institute, "Uptime Institute Global Data Center Survey 2024," Jul. 2024. [Online]. Available: https://uptimeinstitute.com/resources/research-and-reports/uptime-institute-global-data-center-survey-results-2024
[2] S. Bokhari et al., "The Rapid Growth of AI Inference Demand," Stanford Institute for Human-Centered AI, "AI Index Report 2025," Apr. 2025. [Online]. Available: https://aiindex.stanford.edu/report/
Notes
[3] Two companion briefs: "The Generational Leap: How AMD Instinct MI355X Delivers Up to 4.5x More Inference Throughput on Dell PowerEdge XE9785L Servers" and "The TCO Titan: MI355X vs MI300X", both by Metrum AI.
Copyright © 2026 Metrum AI, Inc. All Rights Reserved. This project was commissioned by Dell Technologies. Dell, Dell PowerEdge, Dell iDRAC and other trademarks are trademarks of Dell Inc. or its subsidiaries. AMD, Instinct, ROCm, EPYC and combinations thereof are trademarks of Advanced Micro Devices, Inc. All other product names are the trademarks of their respective owners.
DISCLAIMER - Performance varies by hardware and software configurations, including testing conditions, system settings, application complexity, the quantity of data, batch sizes, software versions, libraries used, and other factors. The results of performance testing provided are intended for informational purposes only and should not be considered as a guarantee of actual performance.