On HPE ProLiant Compute DL380a Gen12 servers powered by Intel Xeon 6 processors: GPU, CPU DRAM, NVMe, and DRAM plus NVMe hierarchy tiers compared, with the hierarchy also validated under HPE Morpheus VM Essentials.
Sustain 2.7x higher agentic inference throughput at 63% lower energy per token, validated across two models, Qwen3-235B-A22B-FP8 and gpt-oss-20b.
Executive Summary
Enterprise agentic workloads are quietly paying for the same work twice. As an autonomous agent reasons across dozens of rounds, its Key-Value (KV) cache grows until it overflows GPU memory, forcing the GPU to recompute context it has already produced rather than generate new tokens.
The HPE ProLiant Compute DL380a Gen12 with Intel Xeon 6787P processors removes that waste by putting the server's full memory hierarchy to work. The GPUs hold active context and stay fully engaged, while CPU DDR5 DRAM and NVMe SSDs persist the overflow and reload it on demand, all within one integrated server.
Metrum AI benchmarked four KV-cache configurations on real agentic traces, across two models that bracket the enterprise range: the flagship Qwen3-235B-A22B-FP8 on all four GPUs and the compact gpt-oss-20b on a single GPU. The DRAM + NVMe hierarchy is the most balanced configuration across the production range on both models, and the outright best at peak scale, sustaining the highest throughput and lowest latency at 512 users with no GPUs added or removed. The same four-tier grid was also run, on both models, inside a dedicated HPE Morpheus VM Essentials guest with PCI passthrough, where the hierarchy's gains held.
Key Results at a Glance
| Up to 2.7x faster time to first token Qwen3-235B-A22B-FP8 at 256 concurrent users, DRAM + NVMe hierarchy vs. GPU-only, on mean TTFT (309.4 s vs. 839.5 s). On a P99 basis the same comparison is 2.3x (552.2 s vs. 1,258.9 s). | Up to 2.7x better energy efficiency Tokens-per-joule improvement at 256 concurrent users, eliminating redundant prefill recomputation (Qwen3-235B-A22B-FP8). |
| Up to 2.7x higher throughput Qwen3-235B-A22B-FP8 at 256 concurrent users: 2.6x on the DRAM + NVMe hierarchy (124.0 tok/s) and 2.7x on CPU DRAM (124.9 tok/s), both vs. 47 tok/s GPU-only. Near-flat scaling under load versus a collapsing GPU-only cache. | 4x more agents within SLA The DRAM + NVMe hierarchy serves 128 concurrent agents within a 300-second P99-TTFT SLA versus 32 for GPU-only, on the same server with no added GPUs. |
| Best configuration at organizational scale At 512 users, where DRAM alone saturates, the DRAM + NVMe hierarchy posts the lowest TTFT (688.9 s) and highest throughput (111.2 tok/s) by spilling overflow to NVMe. | Up to 4.6x faster at peak on gpt-oss-20b The compact model completes the 12,800-request workload in 0.91 h vs. 4.22 h for GPU-only, at 566.8 tok/s sustained, the highest of any tier. |
Agentic Workloads Invert the Inference Problem
Generative-AI value is increasingly judged by the cost-effectiveness of inference rather than the choice of model. As agentic workloads scale, the measure of success shifts from model accuracy to the efficiency of the serving stack. Every second a GPU spends reprocessing context it has already seen is a second not spent generating value, and agentic workloads make this problem acute. A conventional chat request is short and single-turn; agentic workloads invert almost every property of that model:
- Multi-round. Each session runs many rounds. Coding agents iterate over a task, calling tools, reading results, and revising. Representative coding traces show mean session lengths well into the hundreds of rounds.
- Long and growing context. Context grows monotonically. Every tool result, file read, and reasoning step is appended, so the KV cache for a single session expands turn over turn until it dominates VRAM.
- High reuse. Each new turn adds a small amount of fresh text on top of a large reused prefix, producing very high cache-hit potential and shifting the workload from compute-bound to I/O-bound.
- Host-bound phases. The GPU idles during tool execution. Retrieval, code execution, web fetches, and tokenization run on or are orchestrated by the host CPU, creating substantial GPU idle time within every round.
Recent work characterizing agentic execution from the host side finds the CPU to be a first-order bottleneck rather than a supporting actor. For retrieval-augmented pipelines, nearest-neighbor retrieval alone can consume 81 to 89% of end-to-end latency. A serving architecture tuned only for GPU FLOPs leaves the accelerator stalled while the host works. The path to higher effective utilization runs through faster context retention and retrieval, which is exactly what KV-cache offload to DRAM and NVMe provides.
The Case for Keeping Agents On-Premises
Security and IP control. Agents require deep access to proprietary code and sensitive data, so on-premises deployment keeps intellectual property behind the corporate firewall under strict access control.
Predictable economics. Agent workflows can generate volatile, runaway token costs because of large context windows. On-premises infrastructure converts unpredictable per-token operating expense into controlled, fixed capital expense.
Unrestricted leverage. With per-token cost anxiety removed, engineering teams can scale large swarms of autonomous agents for continuous integration and deep codebase modernization without metering each call.
These pressures put the server's memory hierarchy at the center of the deployment decision. The question is not whether to buy a GPU, since every agent deployment needs one. It is how to allocate the rest of the server's memory, and when to activate each layer, to sustain the most concurrent agents within SLA at a given concurrency target.
When the KV Cache Outgrows VRAM, GPU-Only Collapses
GPU VRAM, the fastest memory in the server, is shared between holding the model weights (a fixed cost) and storing the KV cache for active sessions (a variable cost that grows with users and context length). On the flagship workload, Qwen3-235B-A22B-FP8, a sparse mixture-of-experts model with 22B active of 235B total, consumes roughly 235 GB of the four NVIDIA RTX PRO 6000 Blackwell GPUs' 384 GB of combined VRAM. With vLLM permitted 80% of that VRAM (GPU memory utilization 0.80, see Run Configuration), the remaining KV budget is roughly 72 GB, which fills around 32 concurrent users at the 37,000-token average session length.
Above that point the GPU-only configuration must evict sessions to admit new ones, then recompute each evicted session's entire context on its next turn before producing a single output token. The benchmark makes the consequence concrete: at 256 concurrent users, GPU-only TTFT degraded +496% from round 1 to round 25 (195.9 s to 1,168.0 s, a 6x worsening) as VRAM filled and the GPU reprocessed context it had already handled. At 512 users the collapse reaches +524%. This is not a fault of the GPU. It is the result of serving a long-context workload from a single memory layer that is too small for the working set.
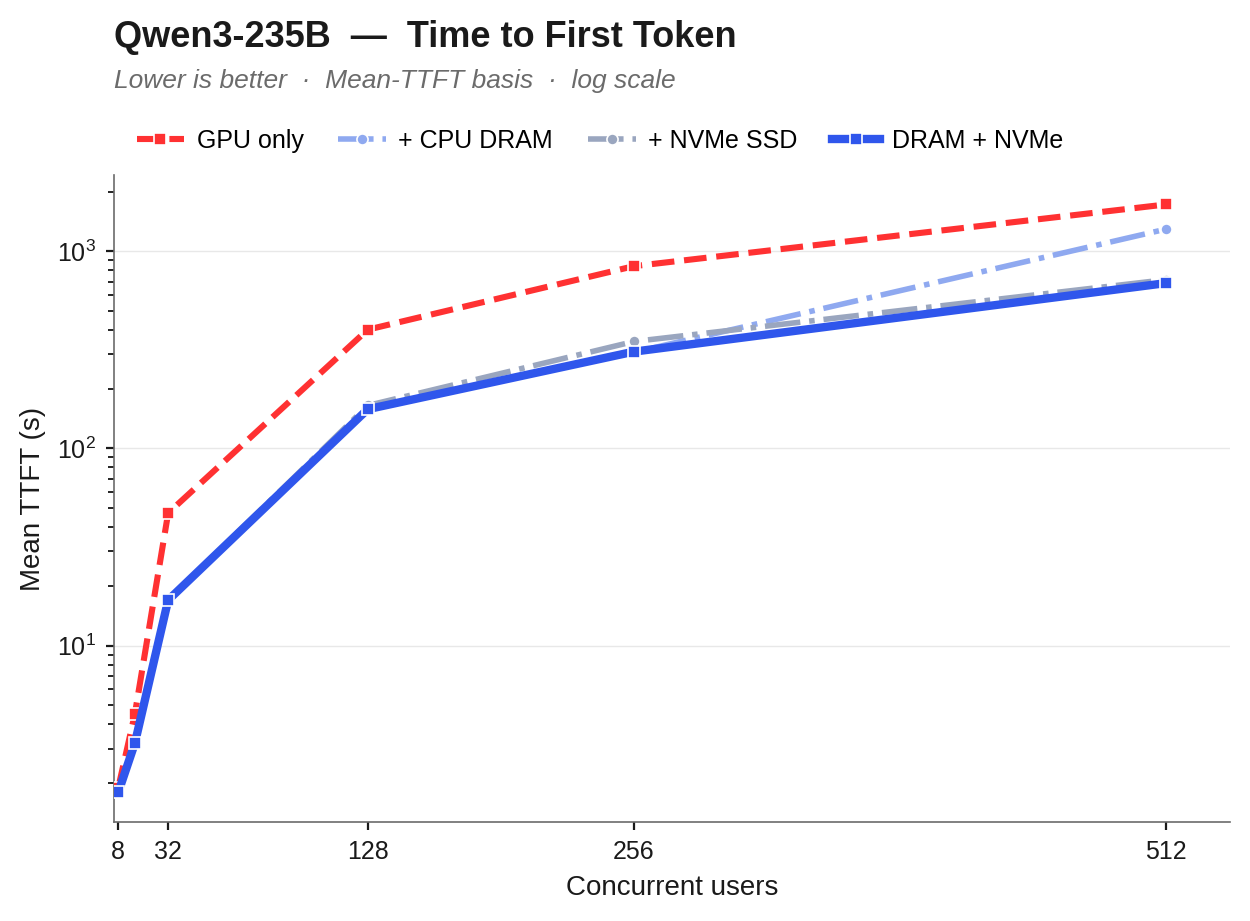
Figure 1 | Qwen3-235B mean TTFT vs concurrency (log scale). GPU-only climbs into multi-minute territory once the KV budget saturates; the offload tiers stay an order of magnitude lower, and the DRAM + NVMe hierarchy is lowest at peak.
The compact gpt-oss-20b shows the same physics on a different timescale. Served on a single GPU with native 128k context, one GPU comfortably absorbs concurrency to 64 users with sub-7-second TTFT and no offload benefit, but at 128 users the KV budget saturates and GPU-only TTFT jumps to 74.6 s, then 215.8 s at 256 and 512.9 s at 512. The offload tiers hold 16 to 42 s at 128 to 256 users; the crossover where offload becomes essential is concurrency 128 for this model, versus conc 32 for Qwen3-235B. The smaller the model, the more KV headroom a GPU has, but the cliff is the same, only later.
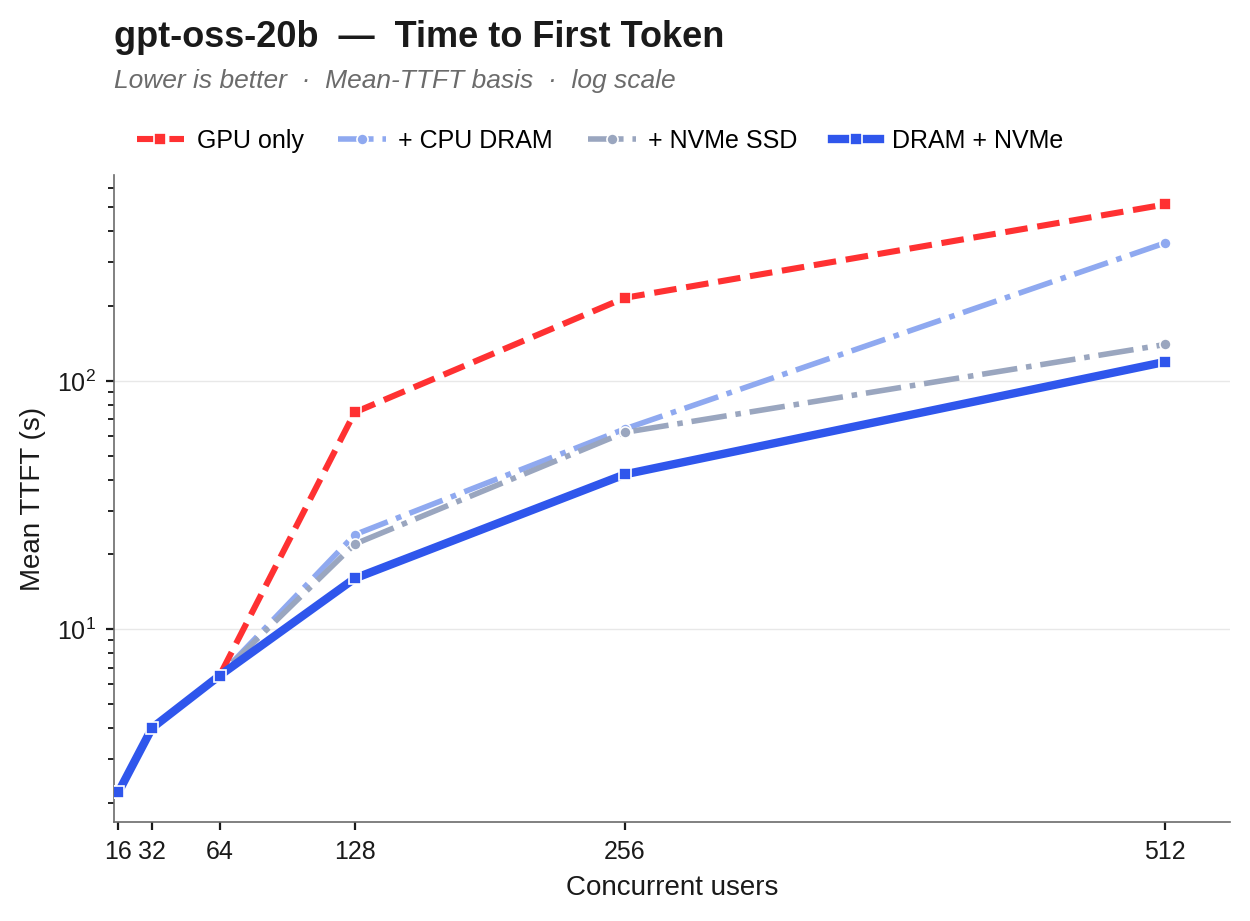
Figure 2 | gpt-oss-20b mean TTFT vs concurrency (log scale). Flat to conc64; at concurrency 128+ GPU-only collapses while the offload tiers stay an order of magnitude lower.
Reload the Cache Instead of Recomputing It
The KV cache does not have to live only in GPU VRAM. Beneath the GPU, the server's CPU DDR5 DRAM and NVMe SSD act as additional KV layers that persist computed tensors instead of discarding them. When a session resumes, LMCache reloads its cache from the nearest layer that holds it rather than recomputing it on the GPU, which removes the prefill penalty for cache hits. Because a reloaded cache contains the same tensors the GPU originally computed, offload is bit-exact: unlike KV quantization or token-eviction schemes, it carries zero accuracy trade-off. The three layers work as one system, and each maps cleanly onto how an enterprise agent uses memory.
| Infrastructure layer | Agent function | Representative workloads |
|---|---|---|
| GPU VRAM | Active reasoning | Code generation, bug fixing, pull-request review |
| CPU DRAM | Working memory | Repository analysis, vulnerability triage, agent orchestration |
| NVMe SSD | Organizational memory | Enterprise code search, remediation history, shared knowledge |
Table 1 | The enterprise agentic memory hierarchy. The full configuration activates all three layers simultaneously, with DRAM serving the hot working set and NVMe absorbing the overflow.
Why the Host CPU Makes Offload Work
The DRAM and full-hierarchy tiers work because of the host. Two Intel Xeon 6787P processors (86 cores per socket, a 16-channel DDR5 subsystem) supply the aggregate memory bandwidth that turns CPU DDR5 into a high-performance KV layer. The 2,048 GB of installed DDR5 holds the working set, and the dual-socket topology stages KV blocks at speed across 176 PCIe Gen5 lanes to the four GPUs, which stay active throughout. Across every cell in the configuration grid, Intel Xeon 6787P CPU utilization stayed below ~4.3% across both models, confirming that the gains come from memory tiering and bandwidth, not additional CPU cores.
Match the Memory Tier to Your Concurrency
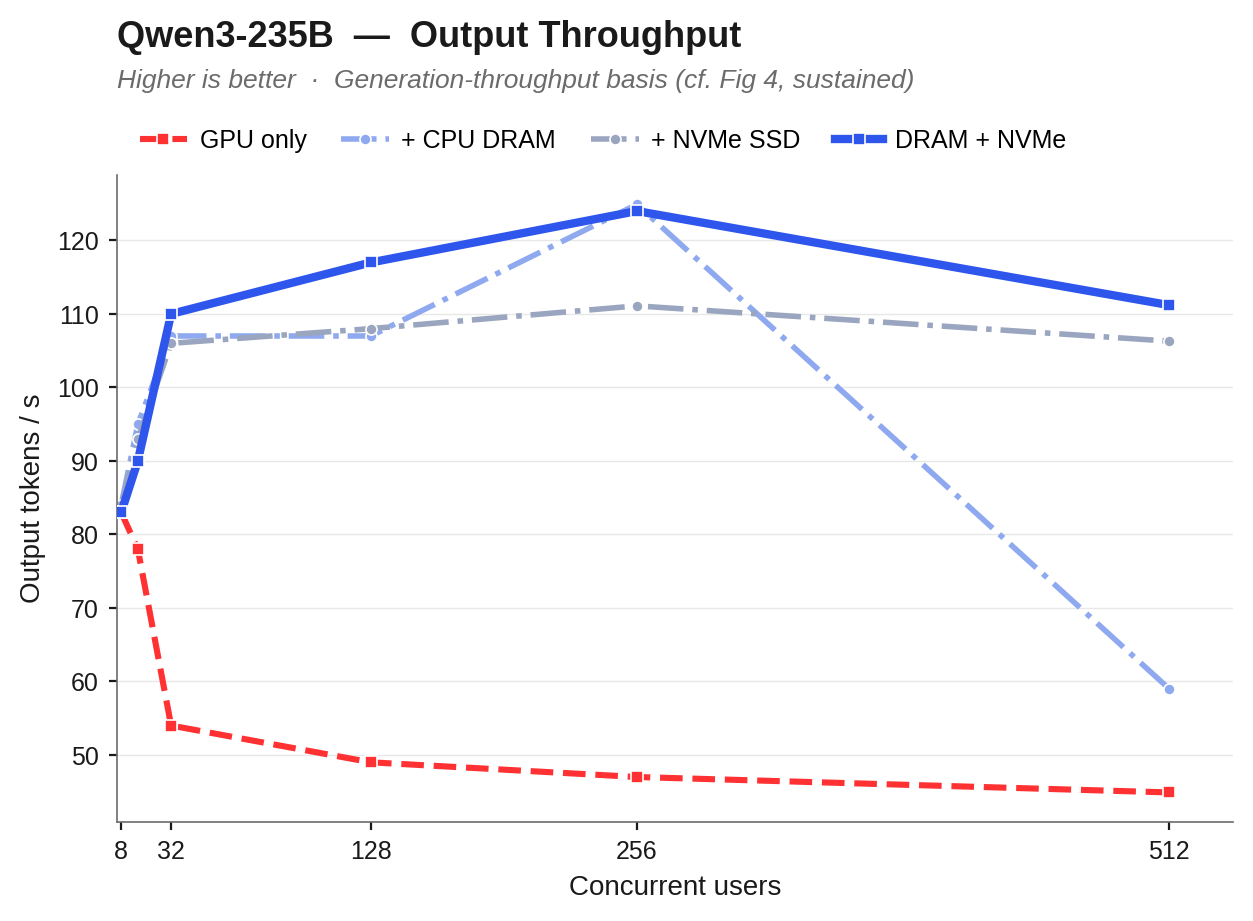
Figure 3 | Qwen3-235B output throughput vs concurrency, sustained basis (total output tokens / wall-clock). Offload tiers deliver 2 to 2.7x the GPU-only throughput once the GPU saturates; the DRAM + NVMe hierarchy leads at peak.
- Light, low-concurrency work. Below the point where the GPU KV cache approaches capacity, roughly 32 users on Qwen3-235B and 64 on gpt-oss-20b, a developer running small tasks can use the GPU layer alone; activating offload adds only 3 to 4% overhead at the lowest concurrencies.
- Production agent fleets. Once concurrency fills GPU memory, activating the DRAM layer raises sustained throughput 2.7x at 256 users while the GPUs keep running. The DRAM + NVMe hierarchy matches DRAM alone here within 1% while keeping NVMe capacity in reserve, the practical production default.
- Organizational scale and persistence. When the working set exceeds DRAM, or KV cache must persist across restarts or be shared across nodes, the NVMe and full-hierarchy configurations sustain full throughput and a ~75% cache-hit rate while DRAM alone has already saturated. At 512 users the DRAM + NVMe hierarchy delivers the highest throughput and lowest TTFT of any tier on both models. In the mid-concurrency range on gpt-oss-20b (128-256 users), the CPU DRAM tier can lead on throughput; the full hierarchy's advantage is its consistency across the full range and its freedom from a saturation cliff.
Qwen3-235B configurations at a glance (256 concurrent users)
| GPU only | + DRAM | + NVMe | + DRAM + NVMe | |
|---|---|---|---|---|
| KV persistence | Volatile | Persistent | Persistent | Persistent |
| Added KV capacity | GPU only | 1,024 GB DRAM | 15 TB NVMe | DRAM + NVMe |
| Avg TTFT | 839.5 s | 307.1 s | 348.3 s | 309.4 s |
| Throughput | 47 tok/s | 124.9 tok/s | 111.1 tok/s | 124.0 tok/s |
| Energy efficiency (tok/J) | 0.033 | 0.090 | 0.089 | 0.089 |
| External hit rate | n/a | 75.5% | 76.2% | 75.6% |
| GPU energy / token | baseline | 63% less | 63% less | 63% less |
Table 2 | Memory configurations compared at 256 concurrent users (Qwen3-235B). The DRAM + NVMe hierarchy is statistically tied with the CPU DRAM configuration here while holding NVMe overflow in reserve.
At 512 Users, DRAM Saturates and the Full Hierarchy Takes Over
The DRAM layer is the right default for production concurrency, but it has a ceiling. At 512 users the Qwen3-235B working set exceeds the 1,024 GB allocated DRAM budget (half of the 2,048 GB installed, deliberately capped to leave ~1 TB of host memory free for the OS and agent orchestration). LMCache can no longer keep the working set resident, the external cache-hit rate collapses from 75.5% to 23.7%, and the DRAM tier begins recomputing context like GPU-only. Its throughput falls to 59 tok/s and TTFT rises to 1,294 s, barely better than GPU-only at the same scale. The NVMe layer has no such ceiling, and the DRAM + NVMe hierarchy combines DRAM speed with NVMe capacity, sustaining a 75.8% hit rate by spilling overflow to NVMe.
| Metric (512 users) | GPU only | + DRAM | + NVMe | + DRAM + NVMe |
|---|---|---|---|---|
| Mean TTFT | 1,725.8 s | 1,294.2 s | 717.1 s | 688.9 s |
| Wall-clock, 12,800 reqs | 12.67 h | 9.58 h | 5.34 h | 5.13 h |
| Throughput | 44.9 tok/s | 59.0 tok/s | 106.3 tok/s | 111.2 tok/s |
| External cache hit | 0% | 23.7% | 75.5% | 75.8% |
| Energy efficiency | 0.031 tok/J | 0.041 tok/J | 0.083 tok/J | 0.084 tok/J |
| DRAM consumed | ~60 GB | ~1,100 GB | ~127 GB | ~1,113 GB |
Table 3 | Qwen3-235B at 512 concurrent users. The NVMe drives peak at only ~16% utilization; the binding ceiling is PCIe Gen5 transfer, not SSD bandwidth.
Note: DRAM consumed figures reflect total host memory in use during the benchmark run, including OS, model-serving processes, and orchestration overhead. For the + NVMe configuration, ~127 GB is the ~60 GB baseline shown in the GPU-only column plus the 64 GB LMCache DRAM buffer (16 GB per TP worker; see Run Configuration).
gpt-oss-20b reaches the same conclusion even more sharply. Its DRAM tier saturates to a 31.8% hit rate at 512 users while NVMe holds 88.4% and the full hierarchy 85.4%. The full hierarchy serves a larger share of its hits from fast DRAM, so it delivers the highest throughput of any tier despite a marginally lower aggregate hit rate than NVMe alone. It completes the 12,800-request workload in 0.91 h versus 4.22 h for GPU-only, a 4.6x speed-up, at 566.8 tok/s sustained. Because the model is small, the full hierarchy never has to read much from NVMe until 512 users, so its overflow path stays nearly free until it is genuinely needed.
| Metric (512 users) | GPU only | + DRAM | + NVMe | + DRAM + NVMe |
|---|---|---|---|---|
| Mean TTFT | 512.9 s | 359.1 s | 140.0 s | 119.2 s |
| Wall-clock, 12,800 reqs | 4.22 h | 2.73 h | 1.07 h | 0.91 h |
| Throughput | 122.8 tok/s | 188.9 tok/s | 485.2 tok/s | 566.8 tok/s |
| External cache hit | 0% | 31.8% | 88.4% | 85.4% |
| Speed-up vs GPU-only (wall-clock) | 1.0x | 1.54x | 3.95x | 4.64x |
Table 4 | gpt-oss-20b at 512 concurrent users. The full hierarchy is the fastest and highest-throughput of all four configurations. Throughput is reported on the same sustained (wall-clock-normalized) basis as every throughput figure in this paper; the speed-up row is the wall-clock ratio.
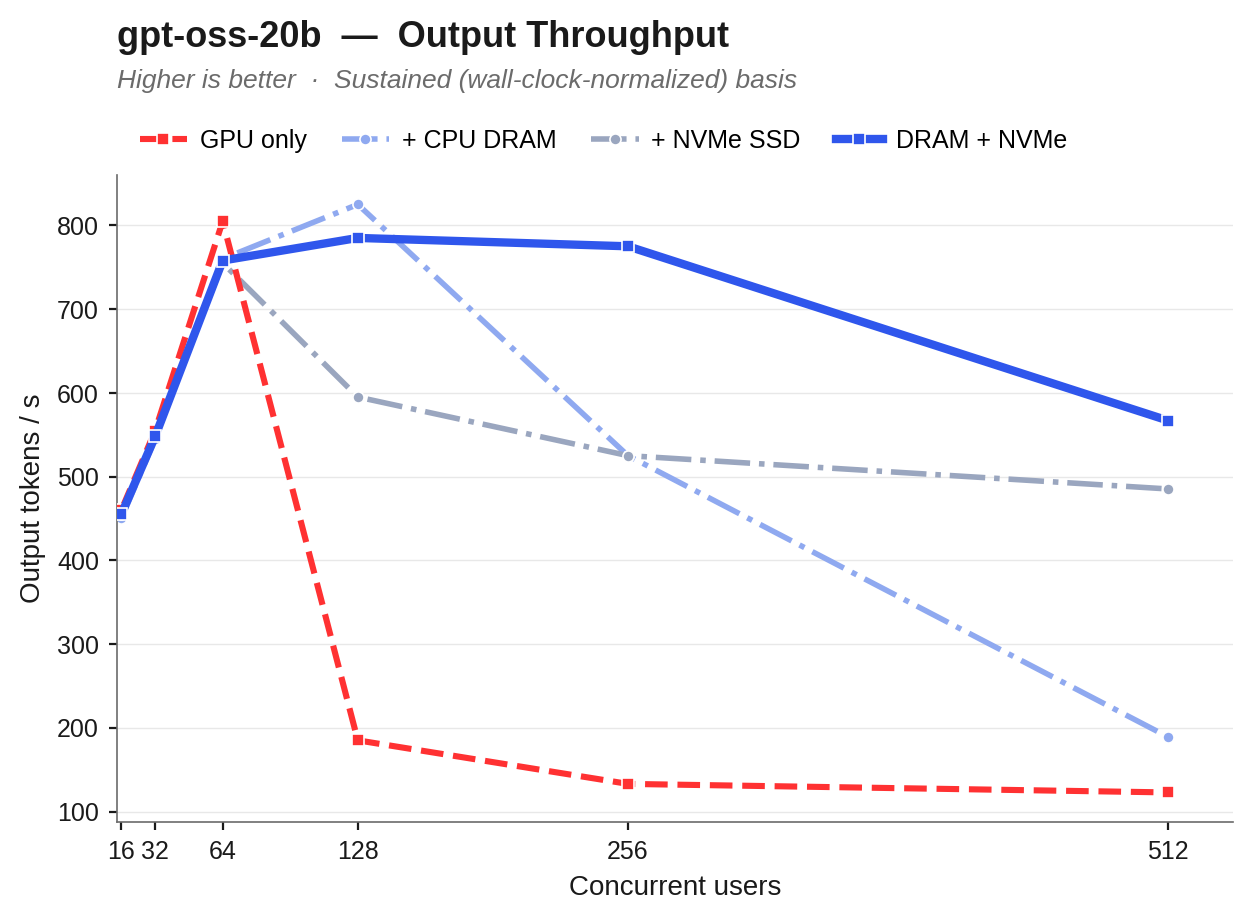
Figure 4 | gpt-oss-20b output throughput vs concurrency, sustained basis (total output tokens / wall-clock), the same basis as Figure 3. Flat to concurrency 64; at concurrency 128+ offload tiers deliver 3 to 5x the GPU-only throughput.
SLA-based capacity on P99 latency (Qwen3-235B)
| TTFT SLA (P99) | GPU only | + DRAM | + NVMe | + DRAM + NVMe |
|---|---|---|---|---|
| 30 sec | 16 users | 16 users | 16 users | 16 users |
| 300 sec | 32 users | 32 users | 32 users | 128 users |
| 900 sec | 128 users | 256 users | 256 users | 256 users |
Table 5 | Maximum concurrent agents within each P99-TTFT target. At the 300-second target used for background fleets, the offload tier serves 128 agents vs 32 for GPU-only, a 4x capacity gain on the same server, with no added GPUs.
Benchmark Methodology
The serving configuration influences TTFT more than the storage tier does, so the configuration is locked identically across all four scenarios and the offload tier is the only variable that changes. Both models share the same server, workload generator and tier definitions.
| Component | Specification |
|---|---|
| Server | HPE ProLiant Compute DL380a Gen12 |
| CPU | 2× Intel Xeon 6787P, 86 cores/socket, dual-socket |
| Memory (DRAM) | 16× 128 GB DDR5 @ 5600 MT/s, 2,048 GB total |
| GPU | 4× NVIDIA RTX PRO 6000 Blackwell Server Edition, 96 GB each, 384 GB total, no NVLink |
| GPU interconnect | PCIe Gen5 x16 per card, roughly 64 GB/s host to device |
| Storage (data) | 2× KIOXIA 15.36 TB NVMe RAID-0, 30.72 TB usable |
| OS / stack | Ubuntu 24.04.3 LTS | vLLM 0.22.0 | LMCache 0.4.6 | CUDA 13.3 |
Table 6 | System under test (shared by both models).
| Model run | Configuration |
|---|---|
| Qwen3-235B-A22B-FP8 | TP=4 (all 4 GPUs) | FP8 | 40,192-token sliding-window context | run full-grid-sliding-safe-20260604T153951Z | 95,900 requests | 0 failures |
| gpt-oss-20b | TP=1 (single GPU) | MXFP4 | native 128k context | run full-grid-128k-20260612T202317Z | 102,100 requests |
Table 7 | The two model runs. Both replay sammshen/lmcache-agentic-traces (SWE-bench Verified, GAIA, WildClawBench), 25 rounds/session, output capped at 512 tokens/round, concurrency 1-512, closed-loop.
Agentic workload
The workload is replayed from real agentic conversation traces rather than generated synthetically, which is the reason the results transfer to production. Sessions are capped at 25 rounds; because TTFT degradation compounds round over round, this is conservative relative to the production coding traces cited earlier, which run to hundreds of rounds. Output length was capped at 512 tokens per round across all runs, while input context accumulated turn over turn.1
| Parameter | Value |
|---|---|
| Dataset | sammshen/lmcache-agentic-traces (Hugging Face) |
| Source tasks | SWE-bench Verified, GAIA, WildClawBench: software engineering, debugging, reasoning |
| Scale | 787 sessions, 24.9K LLM interactions |
| Benchmark tool | LMCache multi_round_qa.py |
| Rounds per session | 25, with context accumulating each round |
| Output tokens | Capped at 512 per round (input not capped) |
| Arrival model | Closed-loop (fixed concurrency) |
Table 8 | Agentic workload
Note on concurrency points. The two runs used slightly different concurrency points. Qwen3-235B was swept at 1, 2, 4, 8, 16, 32, 128, 256, 512 users; gpt-oss-20b at 1, 4, 8, 16, 32, 64, 128, 256, 512. The KV Cache is cleared from all the tiers between concurrencies. Side-by-side comparisons are drawn only at concurrency points present in both runs.
Configurations under test
All four configurations run on the same server with the GPUs installed and active. They differ only in which memory layers the inference engine is allowed to use for KV cache.
| Configuration | Memory layers active | What it establishes |
|---|---|---|
| GPU only | GPU VRAM prefix cache | Reference; the concurrency at which eviction begins. |
| + CPU DRAM | GPU + CPU DDR5 (LMCache) | Whether DRAM removes degradation; the memory needed for flat TTFT. |
| + NVMe | GPU + DRAM buffer + NVMe (LMCache) | Throughput-per-watt and whether IOPS or PCIe binds at scale. |
| + DRAM + NVMe (full) | GPU + DRAM pool + NVMe overflow | The production hierarchy: DRAM speed with NVMe capacity, no saturation cliff. |
Table 9 | The four memory configurations under test. Between runs the cache is cleared and the server restarted before any concurrency change; GPU clocks are locked and the box is single-tenant during steady-state windows.
Results Across Both Models and Every Configuration
DRAM + NVMe hierarchy vs GPU-only at 256 concurrent users (Qwen3-235B)
| Metric | GPU cache only | DRAM + NVMe | Improvement |
|---|---|---|---|
| External cache hit rate | n/a | 75.6% | re-prefill removed |
| Mean TTFT | 839.5 s | 309.4 s | 2.7x faster |
| P99 TTFT | 1,258.9 s | 552.2 s | 2.3x lower |
| Output throughput | 47 tok/s | 124.0 tok/s | 2.6x higher |
| Energy efficiency | 0.033 tok/J | 0.089 tok/J | 2.7x better |
| Agents within 300 s P99-TTFT SLA | 32 users | 128 users | 4x more |
Table 10 | DRAM + NVMe hierarchy vs GPU-only at 256 concurrent users (Qwen3-235B). The full hierarchy matches the CPU DRAM configuration here while holding NVMe capacity in reserve. The 2.7x throughput headline reflects the CPU DRAM configuration (124.9 tok/s); the DRAM + NVMe hierarchy delivers 124.0 tok/s, a 2.6x gain.
Round-to-round degradation at 256 users
| Metric | GPU only | + DRAM | + NVMe | + DRAM + NVMe |
|---|---|---|---|---|
| Qwen - Average TTFT | 839.5 s | 307.1 s | 348.3 s | 309.4 s |
| Qwen - P99 TTFT | 1,258.9 s | 546.3 s | 603.9 s | 552.2 s |
| Qwen - Round 1 to round 25 | +496% | +166% | +183% | +160% |
| gpt-oss - Round 1 to round 25 | +66% | -49% | -29% | -63% |
| External cache hit (both, ~) | n/a | 75-81% | 76-86% | 75-80% |
Table 11 | GPU-only does not merely start behind; it deteriorates as context grows. The offload tiers keep the system generating tokens rather than recomputing context, and at 256 users the full hierarchy actually finishes round 25 faster than round 1 on gpt-oss (-63%).Note: The negative degradation indicates that initial system/warm-up overheads in Round 1 are amortized, and near-perfect prefill avoidance keeps Round 25 extremely fast despite the larger context.
Where the data path binds. On Qwen3-235B at 256 users, combined per GPU PCIe traffic measured ~54.6 GB/s (approaching the ~64 GB/s Gen5 x16 theoretical limit) with the GPU cache alone (recomputation churn) against ~33 GB/s with DRAM and with the full hierarchy; activating offload cuts PCIe traffic ~39% because cache hits eliminate full prefill cycles. The binding ceiling for the offload tiers is PCIe Gen5 transfer, not raw DDR5 or SSD bandwidth.
Throughput and energy. On Qwen3-235B, sustained throughput rose from 47 tok/s (GPU-only) to 124.9 (DRAM) and 124.0 (Full) at 256 users, a 2.7x and 2.6x uplift, while tokens-per-joule improved 2.7x (0.090/0.089 vs 0.033). gpt-oss-20b shows the same inversion at conc256: 0.195 tok/J GPU-only vs ~1.2 to 1.50 tok/J for the offload tiers, 6 to 8x efficiency gain once the GPU stops recomputing context. All energy figures are sourced from Intel RAPL and NVIDIA NVML package telemetry.
The Memory Hierarchy Inside an HPE VM Essentials Guest
Many enterprises standardize on a virtualization layer for lifecycle management, tenancy boundaries, policy enforcement, and operational consistency with the rest of the estate. That raises a fair question for any infrastructure architect evaluating KV cache offload: does the memory hierarchy still work once a hypervisor sits between the workload and the hardware?
Metrum AI tested that question directly. Working with HPE, we ran the same four-tier configuration grid for both models, Qwen3-235B-A22B-FP8 and gpt-oss-20b, inside a virtual machine on HPE Morpheus VM Essentials (VM Essentials), the KVM and libvirt based virtualization platform for HPE ProLiant Compute. The campaign ran on a second DL380a Gen12 with a different processor and memory configuration (Table 12), so its results are reported on their own terms as a platform validation and are not set against the bare-metal figures elsewhere in this paper. Both models completed the full grid, 80 cells and 204,600 requests, and every cell passed audit (request failures below 1%; see the note in the appendix).
For deployment planning, the result is that the hierarchy's gains hold inside the guest. Under full PCI passthrough the guest addresses the accelerators and the storage devices directly. Inside the guest, activating the DRAM + NVMe hierarchy cut Qwen3-235B mean TTFT 2.7x and raised throughput 2.6x at 256 users, and on gpt-oss-20b completed the 12,800-request workload 5.0x faster than GPU-only at 512 users (Table 13). In this configuration the hierarchy delivered its gains in full inside the guest, so teams adopting it on VM Essentials gain the operational model of a managed virtualization platform without redesigning the memory hierarchy that makes agentic inference economical.
| Attribute | Validated configuration |
|---|---|
| Virtualization platform | HPE Morpheus VM Essentials (KVM / libvirt hypervisor with a unified management plane) |
| Host server | HPE ProLiant Compute DL380a Gen12, 2× Intel Xeon 6527P (24 cores per socket; Intel Xeon 6 with P-cores, 8 DDR5 channels and 88 PCIe Gen5 lanes per socket, the same memory and I/O platform as the bare-metal system), 1,024 GB DDR5 |
| Deployment | Single host, non-HCI |
| Workload VM | One dedicated Ubuntu 24.04.4 guest: 80 vCPU (2 sockets × 20 cores × 2 threads, 2 NUMA nodes), 913 GiB memory, no swap |
| Guest shape | Single dedicated guest sized to nearly the whole host, as the TP=4 workload requires: 80 of 96 hardware threads, 913 GiB of 1,024 GB, all four GPUs, both NVMe drives |
| Device assignment | Full PCI passthrough, not mediated vGPU or MIG |
| GPU assignment | 4× NVIDIA RTX PRO 6000 Blackwell passed through to the workload VM, MIG disabled |
| Storage assignment | 2× Samsung PM173Xa15.36 TB NVMe SSD (part VO015360KYDNB) passed through as raw block devices; in-guest md0 RAID-0, XFS at /mnt/md0 |
| CPU and memory policy | Host-passthrough CPU model; guest memory not hugepage-backed or pinned in this campaign |
| Software stack | vLLM 0.22.0 | LMCache 0.4.6 | CUDA 13.3 | NVIDIA driver 610.43.02 |
| KV tiers exercised | GPU only, CPU DRAM, NVMe, and the full DRAM plus NVMe hierarchy; Qwen3-235B DRAM pool sized at 200 GB per TP rank (800 GB) to fit the guest |
| Models and runs | Qwen3-235B-A22B-FP8 (TP4), run qwen3-235b-repeat1-20260904T201300Z, 102,300 requests, 0 failures | gpt-oss-20b (TP1), run gpt-oss-gpu1-full-20260828T212518Z, 102,300 requests, 13 failures (0.013%) |
Table 12 | HPE VM Essentials validation environment. Values are taken from the host and guest inventory captured during the runs (HPE iLO, nvidia-smi, and the guest block layer).
Offload gains measured inside the guest
| Metric, measured inside the guest | GPU only | DRAM + NVMe | Gain |
|---|---|---|---|
| Qwen3-235B, 256 users: mean TTFT | 835.6 s | 310.2 s | 2.7x faster |
| Qwen3-235B, 256 users: throughput | 47.2 tok/s | 123.8 tok/s | 2.6x higher |
| Qwen3-235B, 512 users: mean TTFT | 1,712.1 s | 692.9 s | 2.5x faster |
| Qwen3-235B, 512 users: wall-clock, 12,800 reqs | 12.58 h | 5.17 h | 2.4x faster |
| gpt-oss-20b, 512 users: mean TTFT | 499.1 s | 107.3 s | 4.7x faster |
| gpt-oss-20b, 512 users: throughput (sustained) | 125.5 tok/s | 628.0 tok/s | 5.0x higher |
| gpt-oss-20b, 512 users: wall-clock, 12,800 reqs | 4.11 h | 0.82 h | 5.0x faster |
Table 13 | DRAM + NVMe hierarchy versus GPU-only, both measured inside the HPE VM Essentials guest. Figures are from the virtualized system only and are not to be read against the bare-metal tables in this paper. Guest CPU utilization stayed at or below 10.6% (Qwen3-235B) and 2.7% (gpt-oss-20b) across all 80 cells.
What to plan for
Passthrough trades mobility for proximity to the hardware. A guest with directly assigned devices is generally not live-migratable and is therefore tied to its host; confirm this against the platform documentation and plan availability at the service layer rather than relying on VM mobility. For most agentic inference deployments this is an acceptable exchange, because the serving tier already scales horizontally across replicas and recovers by restarting a replica rather than relocating one.
Scope of this validation
This validation covers both models on HPE Morpheus VM Essentials, executed on a second DL380a Gen12 whose processor and memory configuration differ from the system that produced the other measurements in this paper. Figures from the virtualized system appear only in this section and are identified as such; all other performance figures in this paper describe the bare-metal system. Because the two systems differ, no cell-by-cell comparison between them is drawn, and none should be inferred. Specifically, because the VM host utilized a different CPU SKU (Xeon 6527P vs bare-metal's 6787P) which interacts differently with this specific workload's thread-scaling, absolute baseline performance differs. Cross-environment performance comparisons cannot be drawn. The Qwen3-235B DRAM tier inside the guest used a 200 GB per rank LMCache pool (800 GB) to fit the 913 GiB guest, against 256 GB per rank on the bare-metal system, so that tier's behavior at the highest concurrencies reflects its smaller pool. The guest was a single dedicated virtual machine sized to nearly the whole host, which is the shape a TP=4 model requires. This validates the hierarchy inside a VM Essentials guest with passed-through devices; it does not characterize consolidated or multi-tenant configurations, and smaller guests (for example one GPU and 256 GB of DRAM per gpt-oss-20b replica) were not tested.
Deployment Guidance for Agentic Fleets
- Deploy the full server, then activate every memory layer. The path to the highest sustained throughput is not a different server or fewer GPUs. It is the complete DL380a with its whole memory hierarchy working. Activating offload raised Qwen3-235B throughput 2.7x at 256 users with the GPUs unchanged.
- Make the DRAM + NVMe hierarchy the production default. On both models it matches DRAM through the production range and is the outright best at 512 users, with the lowest TTFT, highest throughput, and best energy efficiency, and no saturation cliff. Unless a node genuinely lacks NVMe or DRAM, run all three layers.
- Treat a single memory layer as non-viable for sustained load. GPU-only degraded Qwen3-235B TTFT nearly 6x (+496%) from round 1 to round 25 at 256 users, and gpt-oss-20b collapses at concurrency 128. For any multi-round, long-context workload above its crossover point, activate DRAM and NVMe from the start.
- Match the deployment to the model. A large MoE like Qwen3-235B fills all four GPUs as one replica and crosses into offload-required territory by roughly 32 users. A compact model like gpt-oss-20b runs one replica per GPU and does not cross into offload-required territory until roughly 128 users; because each replica needs only a single GPU, one four-GPU server can host several independent replicas.
- Offload works inside a dedicated virtual machine. The hierarchy was validated on both models inside a dedicated HPE Morpheus VM Essentials guest with PCI passthrough, where it delivered 2.6x throughput at 256 users on Qwen3-235B and 5.0x faster completion at 512 users on gpt-oss-20b against GPU-only in the same guest. Consolidated or right-sized guests were not tested; validate those shapes before committing to them.
The Bottom Line
Agentic AI has changed what an inference benchmark must measure. The workloads that now drive enterprise spend are multi-round, long-context, high-reuse, and host-bound, and under that profile the efficiency of the memory hierarchy, not raw GPU compute, sets the ceiling on how many agents a node can serve within SLA.
On the same fully configured DL380a in every test, activating the CPU DRAM layer raised sustained Qwen3-235B throughput 2.7x at 256 users while lowering TTFT 63% and improving energy efficiency 2.7x. At 512 users, where DRAM saturates, the DRAM + NVMe hierarchy sustained that lead on a capacity basis, completing the same 12,800-request workload in 5.13 h versus 12.67 h for GPU-only - a 2.47x wall-clock speed-up at 512 users, the best of any tier, while extending KV capacity to organizational scale. The compact gpt-oss-20b tells the same story 4.6x faster at peak. The question is not whether to buy GPUs; every agent server needs them. It is how much of the GPU investment already in place is being spent recomputing context that the server's own DRAM and NVMe could serve in a fraction of the time.
Next steps
- Size your deployment against your own concurrency and SLA targets using these configurations and throughput figures.
- Engage your HPE and Intel account team to model sustained throughput and energy efficiency for your agent workload, at either model scale, on the DL380a Gen12.
- Validate on your traces by replaying a representative agentic workload across the GPU, DRAM, NVMe, and full-hierarchy configurations on the same server.
Appendix: Test Platform Reference
| Field | Value |
|---|---|
| Server | HPE ProLiant Compute DL380a Gen12 |
| CPU | 2× Intel Xeon 6787P (dual-socket, 86 cores per socket) |
| DRAM | 2,048 GB DDR5 @ 5600 MT/s (16× 128 GB RDIMM) |
| GPU | 4× NVIDIA RTX PRO 6000 Blackwell (96 GB VRAM, PCIe Gen5 x16) |
| NVMe (data) | 2× KIOXIA 15.36 TB PCIe NVMe SSDs, RAID-0, 30.72 TB usable |
| Models | Qwen3-235B-A22B-FP8 (TP4) | gpt-oss-20b (TP1, MXFP4, 128k) |
| Software | vLLM 0.22.0 | LMCache 0.4.6 | CUDA 13.3 | Ubuntu 24.04.3 LTS |
| Runs | full-grid-sliding-safe-20260604T153951Z (Qwen) | full-grid-128k-20260612T202317Z (gpt-oss) |
| Workload | sammshen/lmcache-agentic-traces (SWE-bench Verified, GAIA, WildClawBench) |
| Virtualization Validation | HPE Morpheus VM Essentials, full PCI passthrough, on a second DL380a Gen12 (2× Intel Xeon 6527P, 1,024 GB DDR5; 913 GiB guest, 80 vCPU). Both models, full four-tier grid, 80 cells / 204,600 requests. Runs qwen3-235b-repeat1-20260904T201300Z (Qwen) | gpt-oss-gpu1-full-20260828T212518Z (gpt-oss) |
Glossary
| Term | Definition |
|---|---|
| KV cache | The key-value attention state a model builds from context, reused across turns so it is not recomputed for every new token. |
| Prefill | The compute-bound stage that processes the input context and produces its KV cache before any output token is generated. |
| Decode | The memory-bandwidth-bound stage that generates output one token at a time, reusing the stored KV cache. |
| TTFT | Time to First Token, the delay before a response begins, which an agent waits on at the start of every round. |
| External hit rate | The share of KV blocks served from an offload layer (DRAM or NVMe) instead of being recomputed on the GPU. |
| Replica | One independent model-serving instance. Qwen3-235B uses all four GPUs per replica; gpt-oss-20b uses one GPU per replica. |
| MoE | Mixture of Experts, a model design that activates a subset of parameters per token (Qwen3-235B: 22B of 235B). |
| PCI passthrough | Assigning a physical device directly to a virtual machine, so the guest owns the device functions instead of sharing a mediated or emulated version. |
| HPE Morpheus VM Essentials | HPE's KVM and libvirt based virtualization platform for ProLiant Compute servers, pairing the hypervisor with a unified management plane. Referred to as VM Essentials in this paper. |
Run Configuration
| Parameter | Value |
|---|---|
| Model configuration | |
| Models | Qwen3-235B-A22B-FP8 (sparse MoE, 22B active / 235B total) gpt-oss-20b (TP1, MXFP4, 128k) |
| Tensor parallelism | TP=4 across 4 GPUs for Qwen , TP = 1 for gpt-oss-20b |
| KV cache data type | FP16 |
| Context length | 40,192 tokens for qwen; 128,000 tokens for gpt-oss-20b |
| GPU memory utilization | 0.80 |
| vLLM launch config - identical across all tiers | |
| Max sequences | 128,000 (gpt-oss) |
| Max batched tokens | 40,960 (qwen) , 128,000 (gpt-oss) |
| Block size | 16 tokens |
| Prefix caching | Enabled (radix cache, all tiers) |
| Chunked prefill | Enabled |
| LMCache config - CPU DRAM layer | |
| Chunk size | 256 tokens |
| Local CPU | Enabled |
| Max DRAM per TP worker | 256 GB per GPU 1 worker = 256GB (gpt oss 20B) 4 workers = 1,024 GB total (Qwen3-235B) |
| Lazy memory allocator | Enabled |
| LMCache config - NVMe SSD layer | |
| Chunk size | 256 tokens |
| DRAM buffer per TP worker | 16 GB per GPU 1 worker = 16 GB (gpt oss 20B) 4 workers = 64 GB total (Qwen3-235B) |
| NVMe mount path | /mnt/md0/kvcache/ |
| Max NVMe allocation | 15,000 GB (15 TB) |
| O_DIRECT | Enabled |
| Async I/O | Enabled |
| Experimental I/O path | Enabled |
References
- Raj et al. Towards Understanding, Analyzing, and Optimizing Agentic AI Execution: A CPU-Centric Perspective. arXiv:2511.00739, 2025.
- Intel. Intel Xeon 6 Agentic AI Platform Briefing. June 2026.
- Metrum AI, HPE, and Intel. KV Cache Offload Benchmark, full-grid run, Qwen3-235B-A22B-FP8. full-grid-sliding-safe-20260604T153951Z, June 2026.
- Metrum AI, HPE, and Intel. KV Cache Offload Benchmark, full-grid run, gpt-oss-20b. full-grid-128k-20260612T202317Z, June 2026.
- Metrum AI, HPE, and Intel. KV Cache Offload Benchmark: A/B/C/D Comparative Report, Qwen3-235B-A22B-FP8 on HPE VM Essentials. Run qwen3-235b-repeat1-20260904T201300Z, September 2026.
- Metrum AI, HPE, and Intel. KV Cache Offload Benchmark: A/B/C/D Comparative Report, gpt-oss-20b on HPE VM Essentials. Run gpt-oss-gpu1-full-20260828T212518Z, August 2026.
- Hewlett Packard Enterprise. HPE Morpheus VM Essentials Software QuickSpecs. GPU, PCI and NVMe device passthrough to guests.
- Metrum AI. HPE VME KV Cache Benchmark Report v10 (RTX PRO 6000 run). Platform inventory captured from HPE iLO, nvidia-smi and the guest block layer; run gpt-oss-gpu1-full-20260828T212518Z. Source of the validation environment table.
Images
- HPE image attribution : HPE ProLiant Compute DL380a Gen12 product image sourced from Hewlett Packard Enterprise at buy.hpe.com. Hewlett Packard Enterprise, HPE, HPE ProLiant, and the HPE logo are trademarks or registered trademarks of Hewlett Packard Enterprise Development LP.
- Intel image attribution : Intel® Xeon® 6787P processor product image sourced from Intel Corporation at intel.com. Intel, Intel Xeon, and the Intel logo are trademarks or registered trademarks of Intel Corporation in the U.S. and/or other countries.
Copyright © 2026 Metrum AI, Inc. All Rights Reserved. NVIDIA and RTX are trademarks of NVIDIA Corporation. Intel and Xeon are trademarks of Intel Corporation. HPE, ProLiant, Morpheus and VM Essentials are trademarks of Hewlett Packard Enterprise. KIOXIA is a trademark of KIOXIA Corporation
Testing performed by Metrum AI in collaboration with HPE and Intel. All performance figures represent observed measurements under the described test conditions on a single HPE ProLiant Compute DL380a Gen12 configuration. Results vary by model, hardware configuration, software version, and deployment workload, and should not be interpreted as guarantees of performance on different systems. The relative comparisons between memory configurations are the transferable result.
1 Output length was capped at 512 tokens per round across all runs. Input (context) length was not capped and accumulated across rounds, averaging roughly 37,000 tokens per session.