Executive Summary
Enterprises running long-context AI workloads face a hidden tax. Multi-document RAG, financial-filing analysis, coding assistants, and agentic pipelines all push tens of thousands of tokens into the model per request. Each request builds a large key-value (KV) cache in GPU memory. Even a modern accelerator with substantial HBM3e capacity exhausts its capacity under concurrent enterprise load.
When the KV cache exceeds GPU memory, the system discards it and recomputes it from raw tokens on the next request. The GPU spends its most expensive cycles regenerating context it already produced. That cost compounds with every concurrent user until latency and throughput fall sharply. In practice, the enterprise pays twice for the same tokens: once to compute them, once to compute them again.
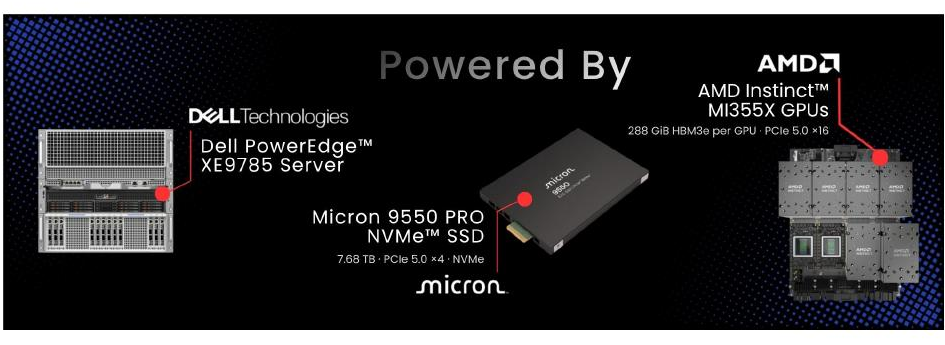
This study evaluates that problem on a leading-edge system: the Dell PowerEdge XE9785 with eight AMD Instinct MI355X GPUs (288 GB HBM3e each). Even 2.25 TB of aggregate HBM3e fails short of the KV cache capacity that production long-context load demands. To eliminate the recomputation penalty, we activate LMCache and offload the KV cache to a tier of Micron 9550 PRO NVMe SSDs. The cache persists on fast storage and reloads on demand. A recurring GPU compute tax becomes a one-time storage read, with no accuracy loss, no added GPUs, and a single configuration change. Time to first token falls by up to 64.8×, and GPU energy per completed request falls by 26.5×.
Key Results at a Glance
The Enterprise Long-Context Inference Crisis
Context Has Become the Primary Bottleneck
Enterprise AI has hit a threshold where serving cost, not model quality, decides which deployments scale. Recent inference-economics research confirms the shift. On-premises operators feel it directly: every GPU cycle spent reprocessing context the model already saw is a cycle not spent producing tokens for a user.1
The root cause is the Key-Value (KV) cache. This study evaluates requests of 77,000 to 100,000 tokens, the scale of a typical SEC 10-K filing, multi-document RAG query, or long-form contract review. Each such request produces 14 to 18 GB of KV cache. In isolation, that number looks manageable. At production concurrency, it is not: at 64 concurrent requests, aggregate KV cache demand reaches roughly 900 GB to 1.15 TB. On the XE9785, each vLLM instance holds a full copy of the Qwen3-235B-A22B model (approximately 235 GB in FP8) across two GPUs. At the configured 0.90 memory utilization, this leaves roughly 283 GB per instance for KV cache, about 1.13 TB node-wide. Demand at C=64 alone reaches that ceiling, and the full 128-document corpus represents 1.8 to 2.3 TB of KV state. Once the working set crosses it, a system without offload must discard cache and recompute from raw tokens on the next request.
The KV Cache Bottleneck on the XE9785
Without KV cache offload, the platform degrades sharply as concurrency rises:
| Concurrency | p99 TTFT |
|---|---|
| C=8 | 81 s |
| C=16 | 278 s |
| C=32 | 690 s |
| C=64 | 1,688 s |
Table 1 | Baseline (GPU-only) p99 time to first token across the concurrency sweep
Throughput moves in the opposite direction, falling from 44 tokens per second at C=8 to 19.2 at C=64. Adding users normally raises total throughput; here it does the opposite. Each new request forces the GPU to recompute evicted context before it can generate, so the accelerators spend most of their time waiting on prefill rather than producing tokens. The idle gap shows up in power draw: average GPU power at C=64 falls to 3,963 W, roughly 34% below the 5,972 W the same GPUs draw when offload keeps them continuously engaged.
This Problem Is Only Growing
Enterprise RAG pipelines already generate this profile of long prompts, simultaneous users, and repeated queries over shared document collections. RAG-augmented queries consume roughly 3 to 5 times more tokens than direct ones. Agentic back-office tools, long-horizon coding assistants, and multi-step reasoning workloads all expand the working set each request demands. As context windows push toward millions of tokens, GPU HBM alone becomes structurally insufficient for concurrent long-context inference at production scale.
Solution: The 3-Tier KV Cache Memory Hierarchy
Reload Instead of Recompute
The solution is KV cache offload. Instead of recomputing evicted context, the system stores it across the full memory hierarchy and reloads it on demand. Offload extends the KV cache across GPU HBM3e, CPU DRAM, and NVMe storage. Context computed once is reused not regenerated.
We implement this with LMCache, an open-source KV cache layer that unifies these three tiers into a single cache visible to vLLM. When a request arrives whose prefix context has been processed before, LMCache checks each tier in order (GPU HBM3e, then CPU DRAM, then NVMe) and loads the cached KV tensors directly into GPU memory, skipping prefill entirely. The loaded tensors are bit-for-bit copies of those originally computed, verified by tensor hash on write and read. Cache offload preserves output exactly, unlike KV quantization or token eviction, which trade accuracy for capacity.
Memory Tiering
| Tier | Hardware on XE9785 | Capacity | Role | Latency |
|---|---|---|---|---|
| ① GPU HBM3e | 8× AMD Instinct MI355X | 2.25 TB (288 GB/GPU) | Active prefix cache: in-flight KV for current requests | Sub-ms |
| ② CPU DRAM | 24× 96 GB DDR5-6400 | 50 GB / vLLM instance | Warm spill: recently evicted KV retained for reuse | ~10-50 ms |
| ③ NVMe RAID-0 | 4× Micron 9550 PRO 7.68 TB | 3 TB / instance (~29 TB) | Persistent: KV survives restarts, shareable across instances | ~50-200 ms |
Table 2 | Three-tier KV cache memory hierarchy on the XE9785
Data Flow Across Tiers
KV tensors flow through the hierarchy on eviction. When an active prefix in GPU HBM3e overflows, LMCache v0.4 evicts it to CPU DRAM over AMD XGMI Infinity Fabric and PCIe 5.0 ×16. When DRAM fills, the eviction persists to the NVMe tier over PCIe 5.0 ×4 per drive using O_DIRECT. All movement runs in 256-token chunks. On a cache hit at any tier, LMCache reloads the stored tensors directly into GPU memory instead of recomputing them.
LMCache manages eviction and reload transparently across all three tiers. O_DIRECT bypasses the Linux page cache to give reproducible NVMe throughput. Chunked prefill in vLLM (max_num_batched_tokens=2048) interleaves decode and prefill work so the GPU stays continuously engaged.
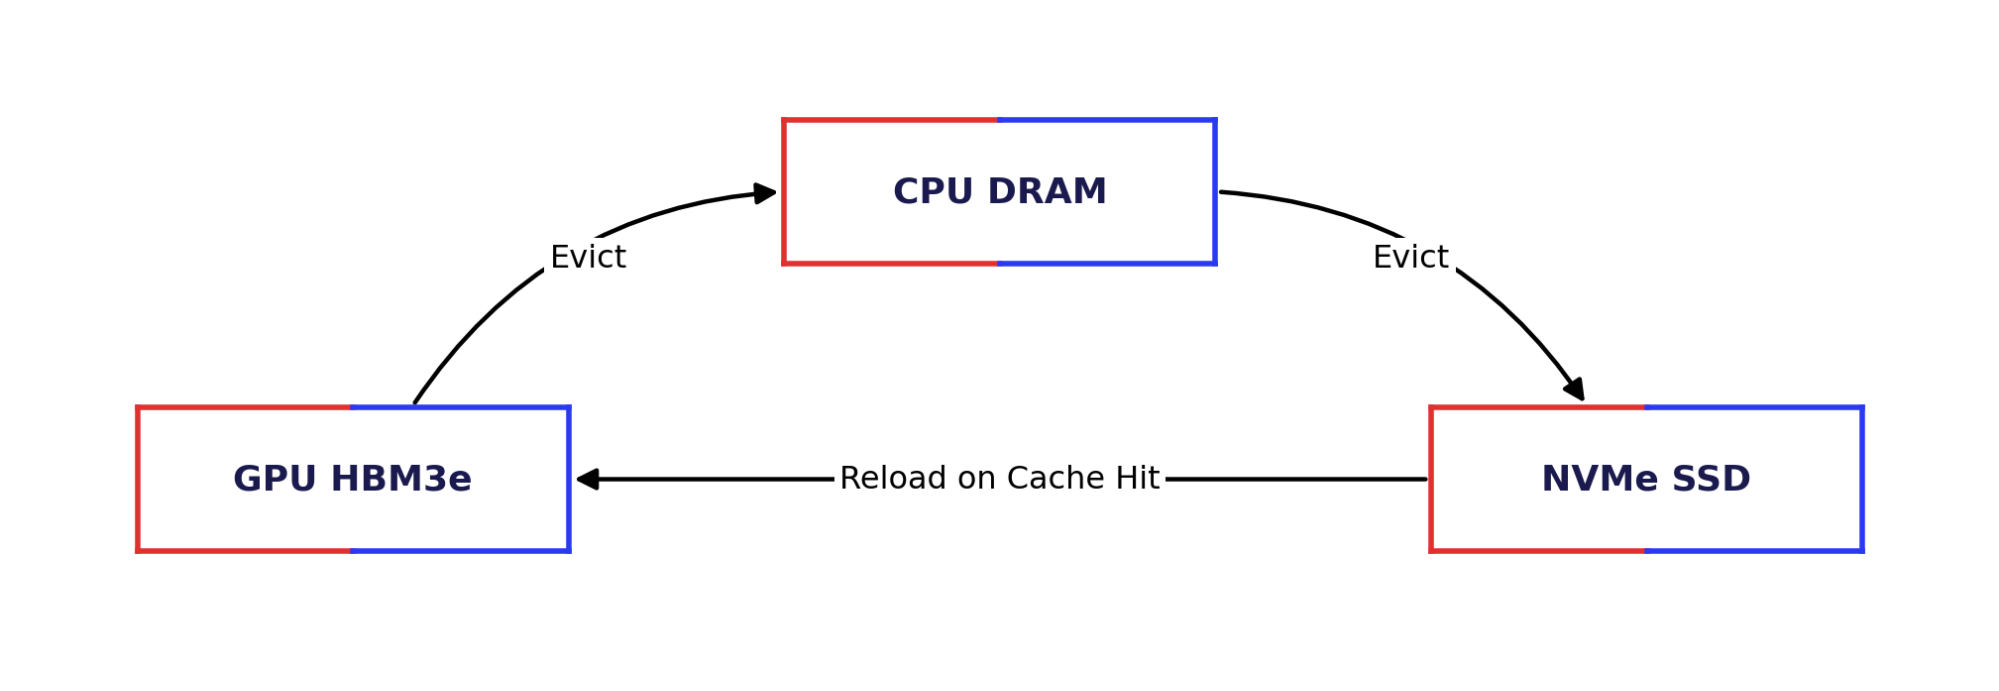
Figure 1 | KV cache flow across the memory hierarchy: evictions cascade downward; a hit at any tier reloads directly into GPU memory.
Benchmark Configuration
| Component | Version | Role / Notes |
|---|---|---|
| vLLM | v0.22.1 (2026-06-05) | Inference engine | Chunked prefill | OpenAI-compatible API |
| LMCache | v0.4 | 3-tier KV cache management | 256-token chunks | O_DIRECT NVMe I/O |
| Model | Qwen3-235B-A22B-Thinking-2507-FP8 | Sparse MoE | 22B active / 235B total | FP8 | max_model_len 131,072 |
Table 3 | Core software stack under test
Hardware Specification
| Subsystem | Component | Specification |
|---|---|---|
| Platform | Dell PowerEdge XE9785 | BIOS v1.4.0 (2026-04-20) |
| CPU | 2× AMD EPYC 9655 (Zen 5) | 96 c / 192 t per socket | 384 logical CPUs | Max boost 4,509 MHz |
| System RAM | 24× Samsung 96 GB DDR5-6400 | 2.25 TB total | RDIMM ECC | NUMA-balanced ~1.1 TiB/socket |
| GPU | 8× AMD Instinct MI355X (CDNA 4) | 288.0 GB HBM3e each | 256 CUs | Max 2,400 MHz | TDP 1,400 W | PCIe 5.0 ×16 |
| Total VRAM | 2.25 TB HBM3e | 8 × 288.0 GB | Peer-to-peer via XGMI | SRAM ECC enabled |
| NVMe: OS | 1× Micron 9550 PRO 7.68 TB | PCIe 5.0 ×4 | FW 1.1.0 |
| NVMe: KV Cache | 4× Micron 9550 PRO 7.68 TB | PCIe 5.0 ×4 each | FW 1.1.0 |
Table 4 | Hardware specification of the system under test
Note: Core specifications cover primary compute and storage components; extended system and environmental details are provided in the Appendix.
Inference Deployment Topology
| Parameter | Value | Notes |
|---|---|---|
| vLLM instances | 4 | Each serves requests independently |
| Tensor parallelism | TP=2 (2 GPUs/instance) | GPU pairs NUMA-affine to CPU socket |
| --max-model-len | 131,072 tokens | Model context length |
| --gpu-memory-utilization | 0.90 | ~518 GB HBM3e per GPU pair for weights + KV |
| --max-num-seqs | 24 per instance | Maximum concurrent sequences per vLLM instance |
| --enable-prefix-caching | Enabled (both configs) | vLLM APC in GPU HBM3e |
| LMCache chunk_size | 256 tokens | ~47 MiB per block at BF16, TP=2, Qwen3-235B-A22B-Thinking-2507-FP8 |
| CPU DRAM tier | 50 GB per instance | 200 GB total across 4 instances |
| NVMe tier | 3 TB per instance | ~12 TB total; RAID-0 XFS ~29 TB pool |
| use_odirect | true | Bypasses Linux page cache; reproducible NVMe throughput |
Table 5 | Inference deployment topology
Benchmark Methodology
Workload and Concurrency Sweep
We selected a real enterprise document corpus rather than synthetic prompts so that results reflect production conditions. The evaluation draws on 128 source documents from SEC EDGAR financial filings and structured Wikipedia topic clusters, content representative of the long-context, shared-corpus workloads that enterprises actually run. Each document spans the 77,000 to 100,000 token range typical of a 10-K filing or multi-document RAG query, and each is paired with eight distinct question variants to produce query diversity over a common knowledge source.
We ran experiments at concurrency levels of 8, 16, 32, and 64, with eight rounds per level. At the start of each round, we sampled a set of documents from the corpus and paired each with its eight question variants to build a request pool. We then dispatched the target number of requests at once, load-balanced across the four serving replicas.
| Concurrency (C) | Prompt Pool per Batch (8×C) | Requests / Batch | Total Batches |
|---|---|---|---|
| 8 | 64 prompts | 8 | 8 |
| 16 | 128 prompts | 16 | 8 |
| 32 | 256 prompts | 32 | 8 |
| 64 | 512 prompts | 64 | 8 |
Table 6 | Concurrency sweep and batch composition
State Isolation and Warmup
We restart the container at the start of each concurrency level to guarantee zero residual KV state. A 128-document prefill warmup then runs before measurement begins.
Performance Results
Result 1: Time to First Token (TTFT)
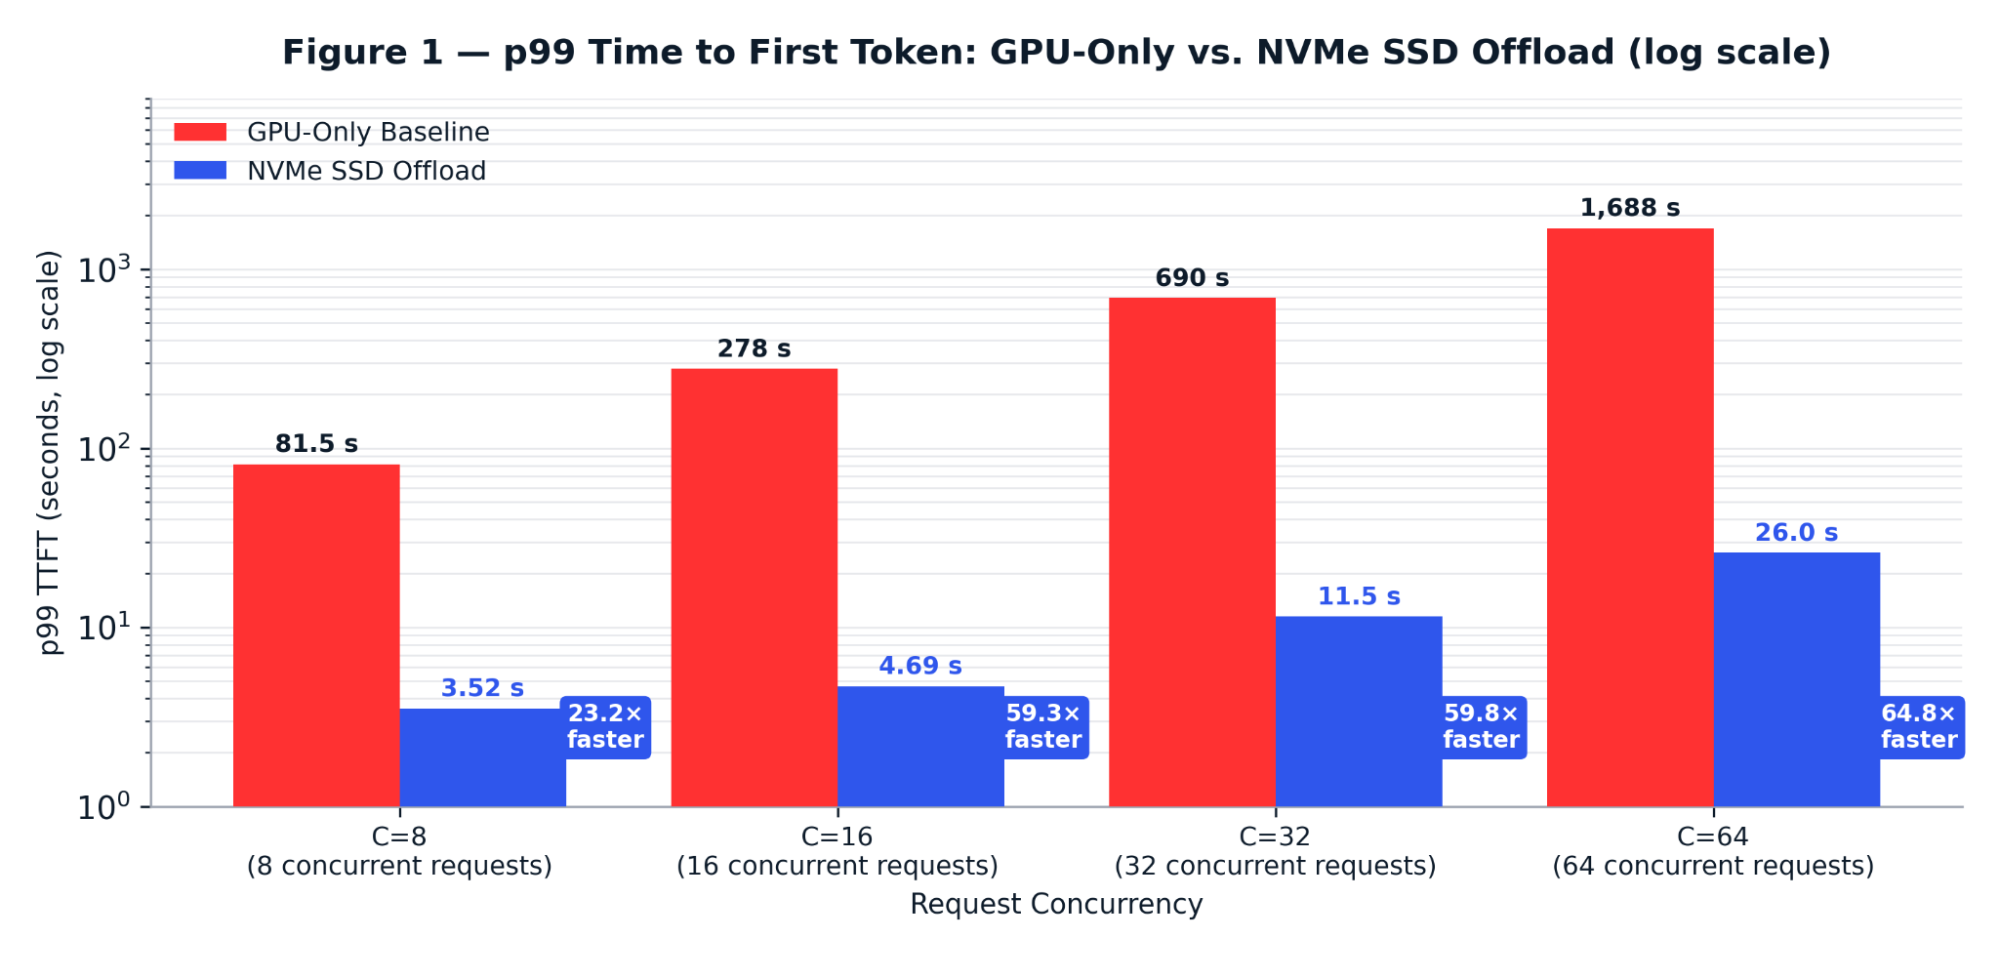
Figure 2 | p99 TTFT: GPU-Only Baseline vs. NVMe SSD Offload (log scale). All four concurrency levels are plotted from measured benchmark runs. (Lower is Better)
Result 2: Generation Throughput
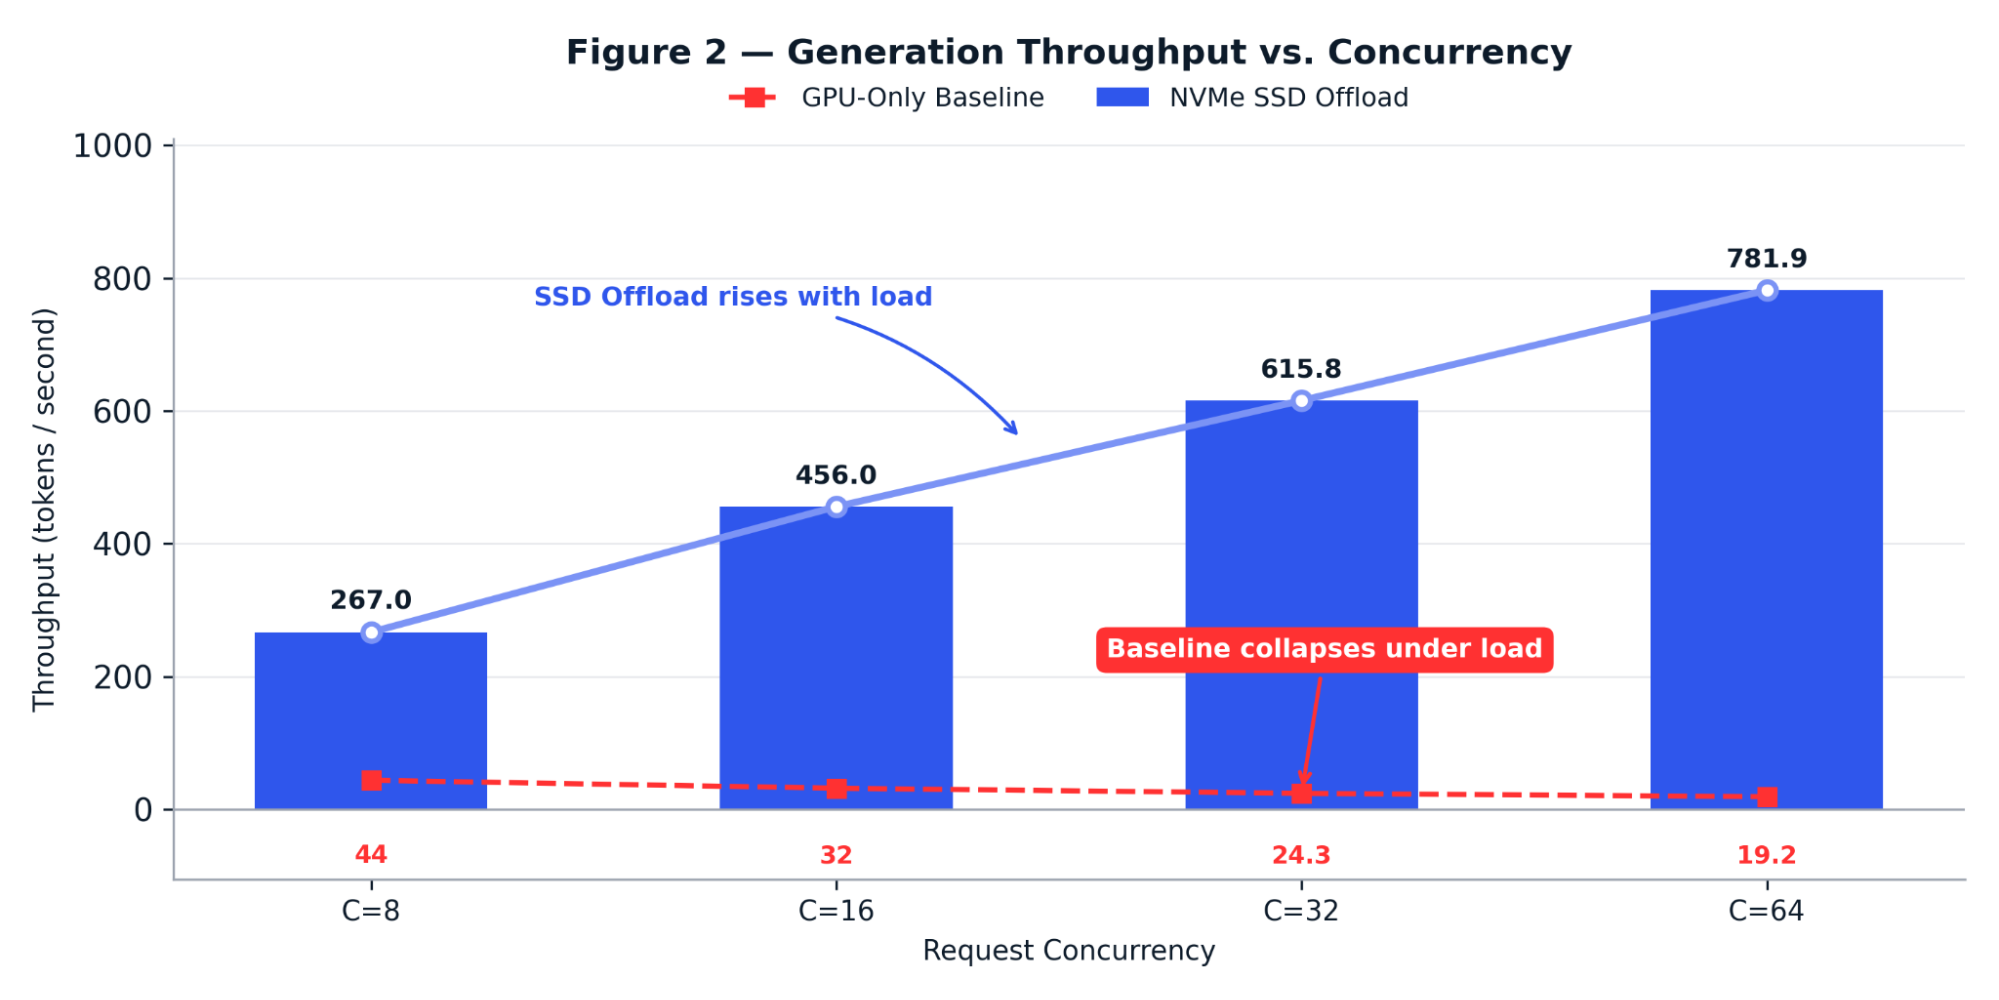
Figure 3 | Generation Throughput (tok/s) vs. Concurrency. Baseline declines while SSD Offload rises; diverging trends confirm the positive scaling effect of NVMe KV caching. (Higher is Better)
Baseline throughput falls monotonically as prefill recomputation consumes more GPU time. SSD offload throughput rises with concurrency as more requests drive the NVMe subsystem toward its 56 GB/s aggregate read ceiling.
Result 3: Energy Efficiency
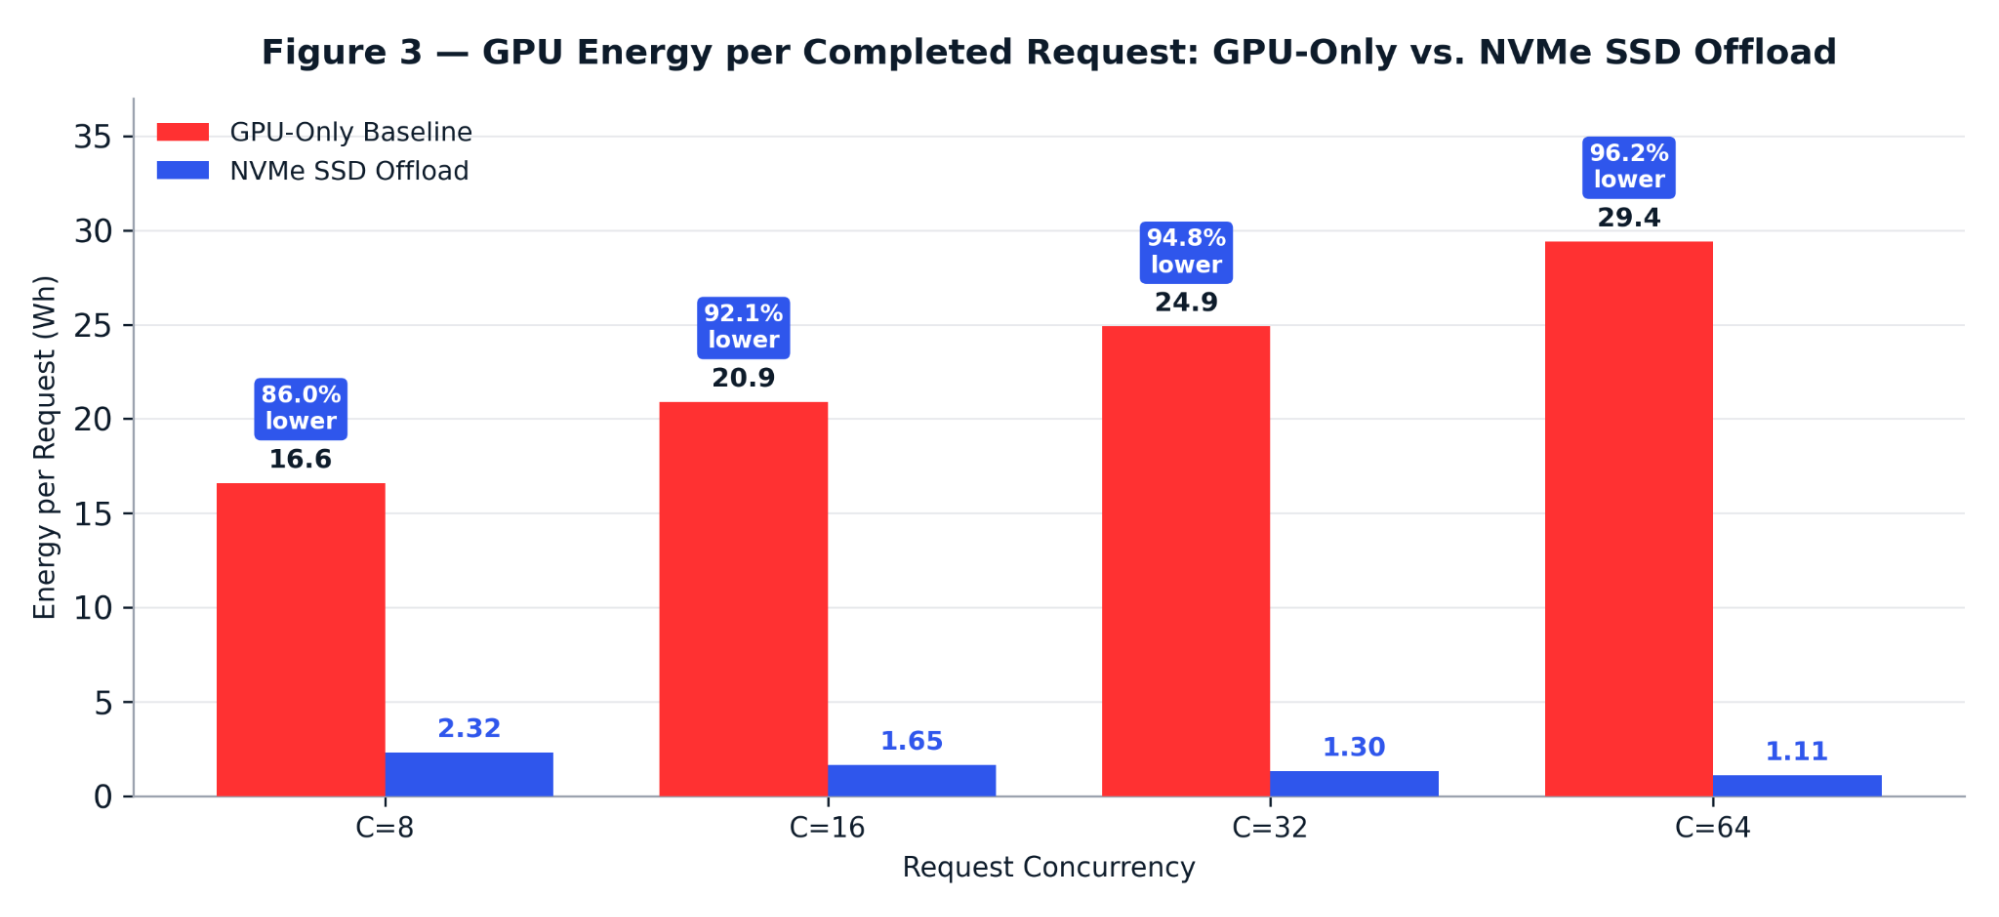
Figure 4 | GPU Energy per Completed Request (Wh) vs. Concurrency. Percentage labels show how much lower SSD Offload energy is at each concurrency level. (Lower is Better)
At C=64, the SSD offload configuration draws more instantaneous power (5,972 W) than the baseline (3,963 W). That is the intended outcome. Higher power reflects higher useful utilization: all eight MI355X GPUs are continuously producing tokens instead of stalling between prefill bursts. Because the platform completes far more requests per unit time, GPU energy per completed request falls by 26.5×. Enterprises extract more work from the same accelerator budget and rack power envelope.
Note: Energy figures are derived from GPU power telemetry only; full-node energy consumption (including CPU, DRAM, and platform power) may differ.
Result 4: NVMe Performance (Micron 9550 RAID-0)
| NVMe Metric | Measured Value | Notes |
|---|---|---|
| Peak aggregate read bandwidth | 56 GB/s | node_exporter 2-s buckets | 4 drives × ~14 GB/s | peak 2-second bucket; sustained LMCache read bandwidth not separately characterized |
| Dominant block size | 512 KB | Uniform across all concurrency levels |
| Filesystem | XFS 4 KiB | noatime, nodiratime | O_DIRECT | 512 KiB chunk |
Table 7 | NVMe performance: Micron 9550 RAID-0
Storage bandwidth is what makes the throughput result possible. At 56 GB/s aggregate read, the four-drive Micron 9550 PRO tier reloads a 16 GB KV cache in roughly 285 milliseconds, well inside the latency budget of a long-context request. Prefill, which would otherwise stall the GPUs for tens of seconds, becomes a sequential storage read that the platform can absorb without draining decode capacity.
Analysis and Key Insights
Why SSD Offload Inverts the Throughput Curve
Once the NVMe tier is warmed, subsequent requests find KV tensors on the Micron 9550 PRO drives. Prefill becomes a storage read at up to 56 GB/s rather than a GPU compute operation. The GPUs begin to decode immediately, and the platform enters a compounding loop: more concurrent requests coalesce more NVMe reads, keep TTFT low, and keep all eight MI355X GPUs producing tokens continuously. At C=64 the system generates 781.9 tokens per second, nearly three times its rate at C=8. Warm-cache performance improves with load until aggregate KV read demand approaches the 56 GB/s NVMe ceiling, where throughput is expected to plateau.
Three Key Insights
Conclusion
The Dell PowerEdge XE9785 pairs eight AMD Instinct MI355X GPUs with the integrated memory hierarchy that long-context inference demands. Combined with KV cache offload, that architecture solves one of the most pressing challenges in enterprise AI infrastructure: serving long-context workloads at concurrent scale without recomputation stalls. The result extends the platform to the next generation of agentic and long-horizon deployments on hardware architects already know how to buy, deploy, and support.
The measured results are consistent across the concurrency sweep. At 64 simultaneous requests against 77K to 100K token enterprise document prompts, p99 TTFT improves 64.8×, generation throughput rises 40.7×, and GPU energy per completed request falls 26.5×, all on identical hardware, with a single software configuration change.
The Micron 9550 PRO NVMe SSDs are the critical enabling component. Their PCIe 5.0 ×4 interface delivers up to 56 GB/s aggregate read bandwidth in a four-drive RAID-0. That is fast enough to bridge the latency gap between GPU HBM3e and persistent storage and keep all eight MI355X GPUs continuously engaged in token generation rather than prefill recomputation.
For enterprise architects evaluating AI serving platforms, GPU compute is necessary but not sufficient. The memory hierarchy beneath the GPU decides whether that compute investment scales under production load. The Dell PowerEdge XE9785 delivers that hierarchy in a single integrated platform: 2.25 TB of aggregate HBM3e, tiered CPU DRAM, and up to 29 TB of NVMe-class Micron 9550 PRO capacity on the same chassis. Architects get the memory depth long-context inference demands without stacking additional servers or trading accuracy for capacity. To evaluate the XE9785 for your long-context workloads, contact your Dell Technologies representative and request a reference architecture that maps your target concurrency and context length to the appropriate DRAM and NVMe tier configuration.
Appendix: Detailed System Configuration
| Subsystem | Component | Specification |
|---|---|---|
| GPU Interconnect | AMD XGMI Infinity Fabric | All-to-all | 1-hop | GPU 0-3: NUMA 0 | GPU 4-7: NUMA 1 |
| OS | Ubuntu 24.04.4 LTS | Kernel 6.8.0-124-generic | PREEMPT_DYNAMIC | Secure Boot disabled |
| GPU Driver | ROCm 7.2.4 | amdgpu 6.16.13 DKMS | GFX950 | SRAM ECC+ | XNACK disabled | ppfeaturemask 0xfff7bfff |
| Kernel params | iommu=pt amd_iommu=pt | PCIe DMA passthrough eliminates IOMMU translation overhead |
| GPU thermals | Junction 52-62 °C | Mem 36-46 °C | Idle draw 260-278 W per GPU | All 8 within normal range |
| Drive health | 100% spare | 0 media errors | All 5 drives | POH ~520 h | 3 power cycles | Verified pre/post-test |
Table 8 | System Configuration
| Component | Version | Role / Notes |
|---|---|---|
| ROCm | 7.2.4 | GPU runtime | rocBLAS, MIOpen, RCCL, hipFFT |
| amdgpu | 6.16.13 DKMS | GFX950 / MI355X kernel module |
| Docker | 29.1.3 | vllm-lmcache-rocm: 52.4 GB | vllm-rocm: 51.9 GB |
| Monitoring | Prometheus | rocm-smi (GPU power) | node_exporter (host) | eBPF nvmetrace |
Table 9 | Software Configuration
Configuration Recommendations by Scenario
| Scenario | Recommended Tier | Rationale |
|---|---|---|
| C ≤ 8, prompts < 32K tokens | GPU HBM3e only | KV fits within HBM3e. Operators MAY skip offload; overhead is not justified. |
| C = 16-32, 77K-100K tokens | 3-tier: HBM3e + DRAM + NVMe | Operators SHOULD enable 3-tier offload. DRAM absorbs warm evictions; NVMe handles overflow and persistence. |
| C = 64+, concurrent document analysis | 3-tier, max NVMe allocation | Operators MUST allocate the maximum NVMe tier and MUST size it so that cached KV for the full prompt pool persists across evictions; TTFT stays bounded. |
Table 10 | Configuration recommendations by scenario
Measurement Definitions
| Metric | Definition | Instrument |
|---|---|---|
| TTFT (p50/p90/p99) | Wall-clock from batch dispatch to first streamed content token. Percentiles across all requests × all batches. | Application timer |
| Generation throughput | Output tokens/second across all concurrent requests during the decode phase. | vLLM metrics endpoint |
| GPU energy/request (Wh/req) | Trapezoid integral of Σ(8 GPU power) over batch window ÷ 3600 ÷ n_req. | rocm-smi → Prometheus |
| NVMe read bandwidth | Aggregate read bandwidth across the 4-drive RAID-0, sampled at 2-second intervals. | node_exporter + eBPF nvmetrace |
| GPU average power | Mean 2-second rocm-smi samples over batch window, summed across 8 GPUs. | AMD SMI exporter |
Table 11 | Measurement definitions
Configuration Parameters: GPU-Only Baseline vs. NVMe SSD Offload
All vLLM parameters are identical across both configurations. The only variable is whether the LMCache KV transfer connector is activated, which isolates the memory hierarchy effect from any serving-configuration difference.
| Parameter | GPU-Only Baseline | NVMe SSD Offload |
|---|---|---|
| --tensor-parallel-size | 2 | 2 |
| --max-model-len | 131,072 | 131,072 |
| --gpu-memory-utilization | 0.90 | 0.90 |
| --max-num-seqs | 24 | 24 |
| --enable-prefix-caching | Enabled | Enabled |
| --enable-chunked-prefill | Default (V1) | Default (V1) |
| --max-num-batched-tokens | 2,048 (V1 default) | 2,048 (V1 default) |
| --kv-transfer-config | Not set | LMCacheConnectorV1 |
| LMCACHE_USE_EXPERIMENTAL | Not set | True |
| LMCache chunk_size | N/A | 256 tokens |
| LMCache max_local_cpu_size | N/A | 50 GB / instance |
| LMCache max_local_disk_size | N/A | 3,000 GB / instance |
| LMCache use_odirect | N/A | true |
| Instances / GPU allocation | 4 instances | TP=2 | 4 instances | TP=2 |
| Software | vLLM v0.22.1 | ROCm 7.2.4 | vLLM v0.22.1 | LMCache v0.4 | ROCm 7.2.4 |
Table 12 | Configuration comparison: GPU-only baseline vs. NVMe SSD offload
References
| 1. | Dell product image: Dell PowerEdge XE9785 Server product image courtesy of Dell Digital Asset Management (DAM), Dell.com. |
| 2. | Micron product image: Micron 9550 NVMe SSD product image courtesy of Micron Technology, Inc. Image Gallery, Micron.com. |
| 3. | AMD Instinct MI355X GPU product image courtesy of AMD Amplify, amplify.amd.com. |
| 4. | B. Zhuang et al., "Beyond Benchmarks: The Economics of AI Inference," arXiv:2510.26136, 2025. [Online]. Available: https://arxiv.org/abs/2510.26136 |
Disclaimer
Testing performed by Metrum AI in collaboration with Dell Technologies, AMD, and Micron. All performance figures represent observed measurements under the described test conditions on a single Dell PowerEdge XE9785 configuration. Results vary by model, hardware configuration, software version, cache state, and deployment workload, and should not be interpreted as guarantees of performance on different systems. The relative comparisons between memory configurations are the transferable result.
AMD, Instinct, and EPYC are trademarks of Advanced Micro Devices, Inc. Dell, Dell Technologies, and PowerEdge are trademarks of Dell Inc. Micron is a trademark of Micron Technology, Inc.
Copyright © 2026 Metrum AI, Inc. All Rights Reserved.