An on-premises, GPU-accelerated defect detection, root cause analysis, and compliance reporting solution from Metrum AI, deployed on the Supermicro SuperWorkstation A+ Server AS -2115HV-TNRT with four AMD Radeon™ AI PRO R9700S GPUs.
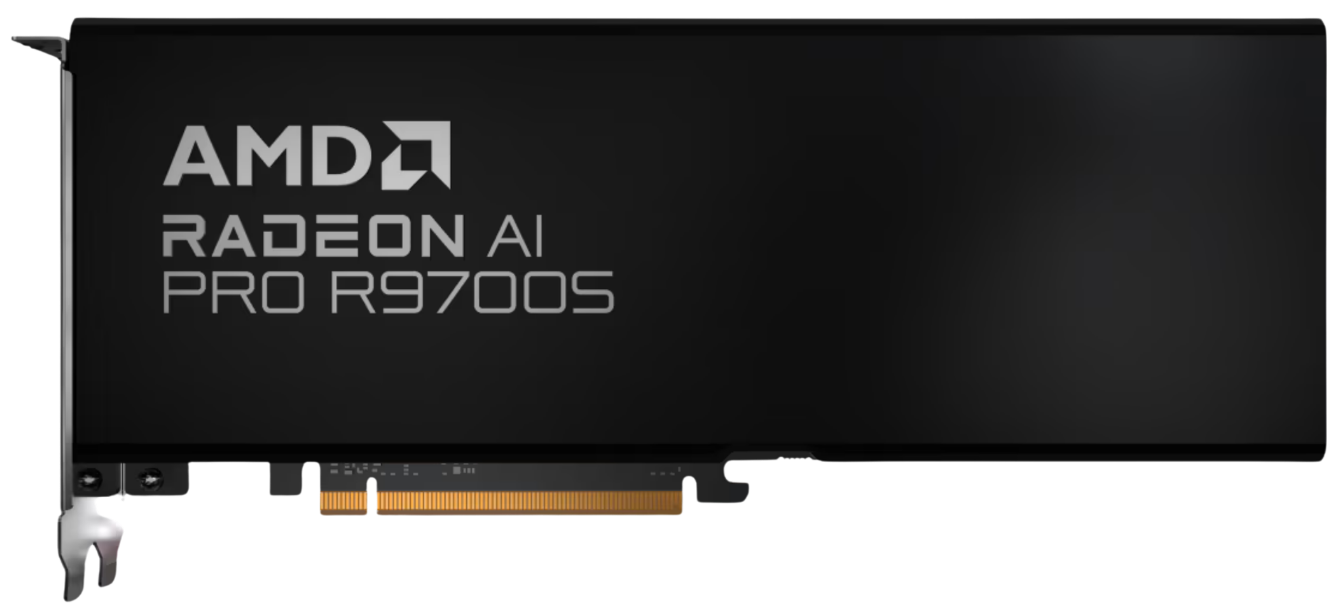
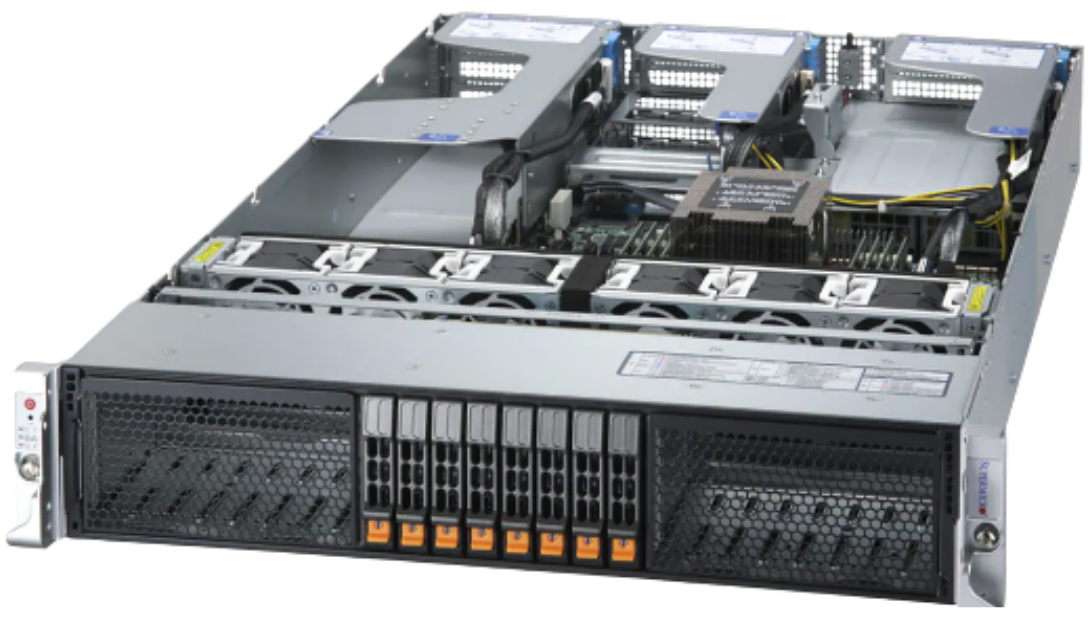
Prepared in collaboration with AMD and Supermicro.
Executive Summary
Quality escapes are the most expensive defects a manufacturer produces. A board that passes inspection and fails in the field costs a warranty claim, a customer relationship, and often a recall investigation. Manual visual inspection cannot prevent that at line speed, and traditional automated vision only catches the defect types someone trained it on. Novel failure modes stay invisible until an engineer retrains the system, which usually happens after the escape.
Metrum AI built this solution to catch both categories in one pass. It monitors 12 PCB inspection stations in real time, scores every frame for anomaly rather than matching against a fixed defect list, and produces a pixel-level mask over each flagged region. A vision-language model then explains the finding in plain language, naming the component, the severity, the likely root cause, and the recommended corrective action.
A three-agent pipeline turns that finding into a quality report that retrieves the applicable clauses from the manufacturer's own licensed standards library, downloadable as a PDF for quality managers and auditors. Everything runs on a Supermicro SuperWorkstation A+ Server AS -2115HV-TNRT with four AMD Radeon AI PRO R9700S GPUs and the AMD ROCm software stack. Once model weights and container images are staged locally, the system runs fully offline, so inspection imagery containing proprietary product geometry never leaves the plant.
This brief describes the quality problem, the solution, its architecture, and the outcomes manufacturers can expect. It is written for quality directors, plant and manufacturing IT leaders, operations executives, and infrastructure architects evaluating on-premises AI for the production line. The figures in this brief come from a Metrum AI demonstration on the reference configuration in Table 3, running the sample PCB inspection footage bundled with the solution repository.
The Business Challenge
PCB assembly lines generate a continuous stream of camera frames across multiple stations. Inspection has to keep pace with that rate, stay consistent across shifts, and leave behind a record that connects a rejected part to the process that produced it. Most inspection programs deliver none of the three reliably.
Where Manufacturers Lose Margin Today
The losses are structural rather than a matter of operator diligence. Four gaps recur across assembly lines, and each one carries a cost.
| Operational Gap | Business Consequence |
|---|---|
| Manual inspection cannot hold pace or consistency | Operators review hundreds of units per hour under fatigue and variable lighting. Detection rates drift between shifts, so the same defect passes on one shift and fails on another. |
| Rule-based vision only sees trained defect classes | A novel failure mode stays invisible until an engineer notices the field returns and retrains the model. The escape has already shipped by the time the system learns to catch it. |
| Findings arrive as scores, not explanations | A confidence number tells an operator to reject a board but not why it failed or what upstream process to adjust. Corrective action waits for an engineer to investigate. |
| No data trail links a reject to its root cause | Without a defensible record tying the defect, the station, and the applicable standard together, audits and customer quality reviews turn into manual reconstruction. |
Table 1. Recurring gaps in visual quality inspection and their cost to the manufacturer
Why Cloud-First AI Falls Short for Inspection Imagery
Vision AI answers these gaps, and many vendors deliver it as a cloud service. For inspection imagery specifically, that architecture creates problems a manufacturer cannot negotiate away.
- Inspection frames are product design data. A close-range image of a populated board reveals component selection, placement, and routing. Routing that imagery to a third-party inference service exports the intellectual property the manufacturer spent years developing.
- Line uptime cannot depend on a network. An inspection station that stops deciding when connectivity drops stops the line behind it. Local inference removes the dependency entirely.
- Cost scales with frame rate. Per-inference pricing against every frame from every station turns quality control into a variable cost that grows with production volume.
Running inference in the plant resolves all three, and it keeps the inspection decision on the line rather than at the end of a network round trip.
The Market Shift: From Defect Matching to Defect Understanding
Three developments have moved automated inspection past the trained-class ceiling that has limited it for two decades.
- Foundation vision models detect the unfamiliar. Modeling what a good unit looks like, then scoring deviation from it, flags defects nobody anticipated. Inspection no longer depends on having collected examples of every failure mode first.
- Segmentation localizes the finding precisely. A pixel-level mask over the defective region gives an operator something reviewable, and it gives a process engineer a coordinate rather than a verdict.
- Vision-language models explain what they see. A model that reads the frame and writes the assessment turns a score into a root cause hypothesis and a corrective action, which is the part a human previously had to supply.
These shifts change what inspection produces. The output is no longer a pass or fail verdict but an explained finding a quality team can act on.
Solution Overview
The solution turns factory camera feeds into a real-time inspection pipeline covering detection, anomaly scoring, segmentation, and vision-language root cause analysis. It monitors 12 inspection stations across four PCB product categories, and every frame returns a verdict, an anomaly score, and an inference latency figure to the operator.
Multi-GPU parallelism separates the detection and segmentation path from the analysis workloads. Alerts reach the operator while reports generate in the background, so the depth of the analysis never slows the line decision.
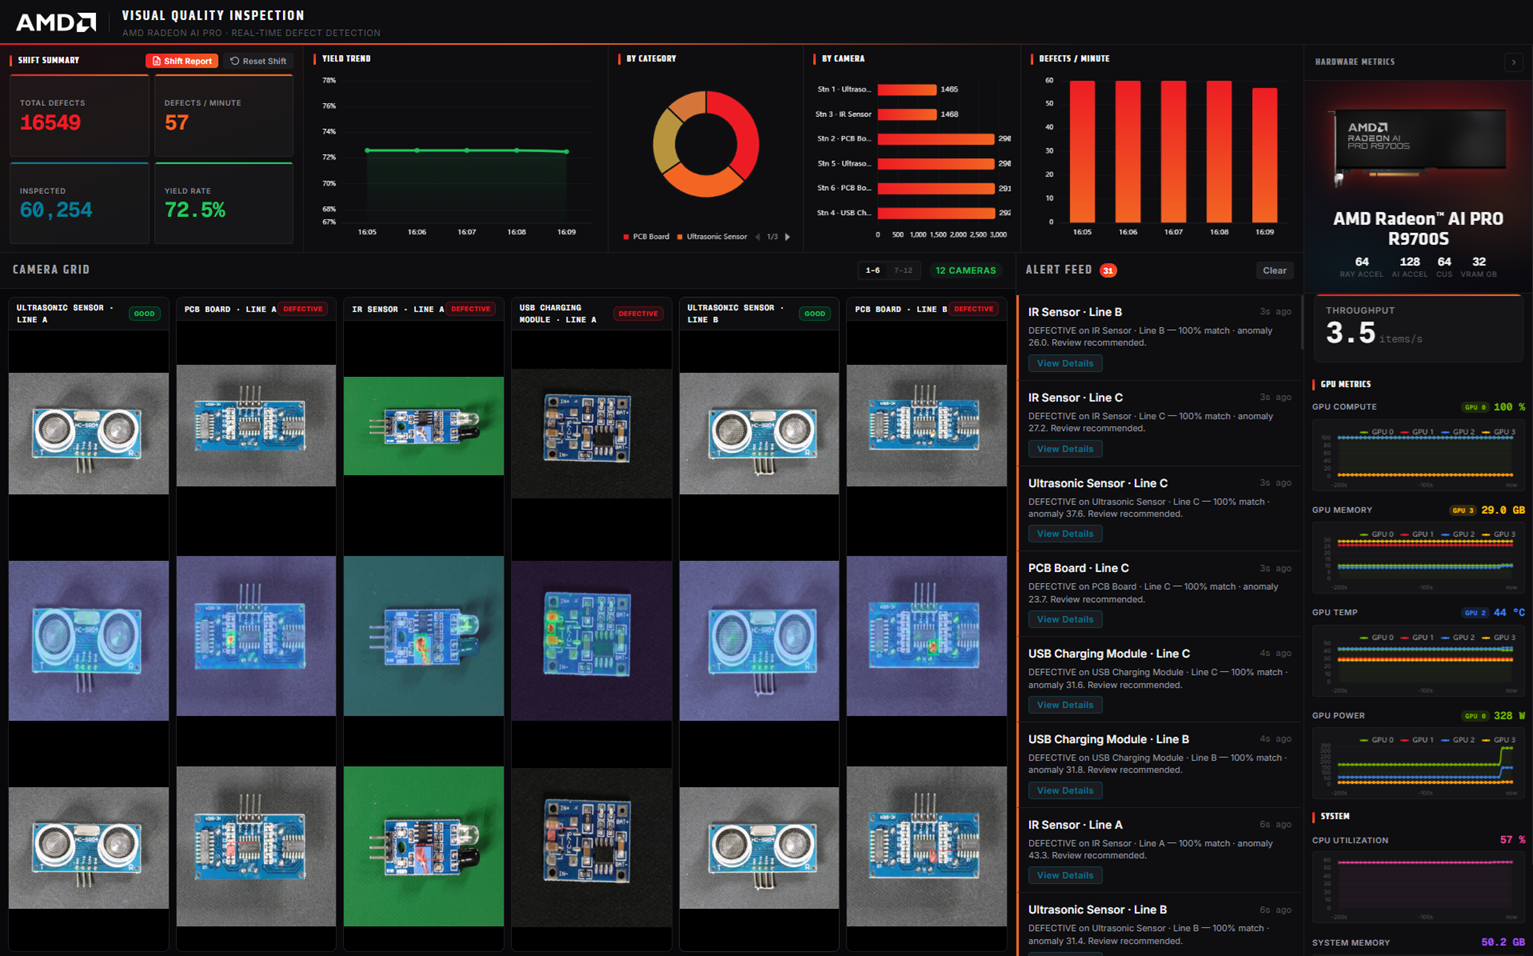
Figure 1. The live camera grid shows every inspection station with its verdict, anomaly score, and latency, with defective frames highlighted
Simulated data. Boards, defects, and yield figures shown are illustrative.
Capability Highlights
| Capability | What It Delivers |
|---|---|
| Real-time anomaly detection | 12 PCB stations monitored simultaneously on four AMD Radeon™ AI PRO R9700S GPUs with the AMD ROCm™ stack, with per-frame anomaly scores and live heatmap overlays. Detection models deviation from good units, so novel defects surface without prior training examples. |
| Pixel-level defect segmentation | Every detected anomaly refines into a precise segmentation mask with overlap scores and area annotations, giving operators a reviewable region rather than a bounding box. |
| Vision-language defect analysis | A local vision-language model produces a plain-language assessment for each flagged frame, covering defect type, severity, location, likely root cause, and recommended corrective action. |
| Standards-grounded quality reporting | A three-agent pipeline retrieves clauses from workmanship and tolerance standards held in a local vector index, such as IPC-A-610, IPC J-STD-001, and ISO 2768, then compiles a downloadable PDF with corrective actions and escalation guidance. Manufacturers load their own licensed copies. |
| live GPU telemetry | One dashboard carries yield rate, defects per hour, breakdowns by product category and by station, and live accelerator telemetry, with no switching between tools. |
| Shift-level AI summary | Supervisors generate an analyzed summary of the shift's yield and defect trends, exportable as a PDF for the quality organization. |
| Flexible GPU deployment | Setup detects the GPU count and enables features accordingly, so a line can start with detection only and add analysis and reporting as the deployment grows. |
Table 2. Capability highlights and the operational value each one delivers
How the Solution Works
The solution follows a four-stage pipeline that runs continuously on the local system.
- Capture. A media server ingests camera streams from the inspection stations, and a hardware-accelerated video pipeline decodes each feed. An object isolation step crops the unit from its background before analysis.
- Detect and segment. An anomaly detection model scores every frame against a learned model of good units and generates a heatmap. Flagged regions pass to a segmentation model that produces the pixel-level mask. Both run on the AMD Radeon™ AI PRO R9700S GPUs.
- Classify and alert. A threshold engine assigns each frame a verdict of good or defective. Defective frames highlight in the grid and enter the live alert feed with station, timestamp, and confidence.
- Analyze and report. A vision-language model characterizes the defect and proposes a root cause. On request, the agent pipeline retrieves the applicable standards excerpts and compiles the full compliance report.
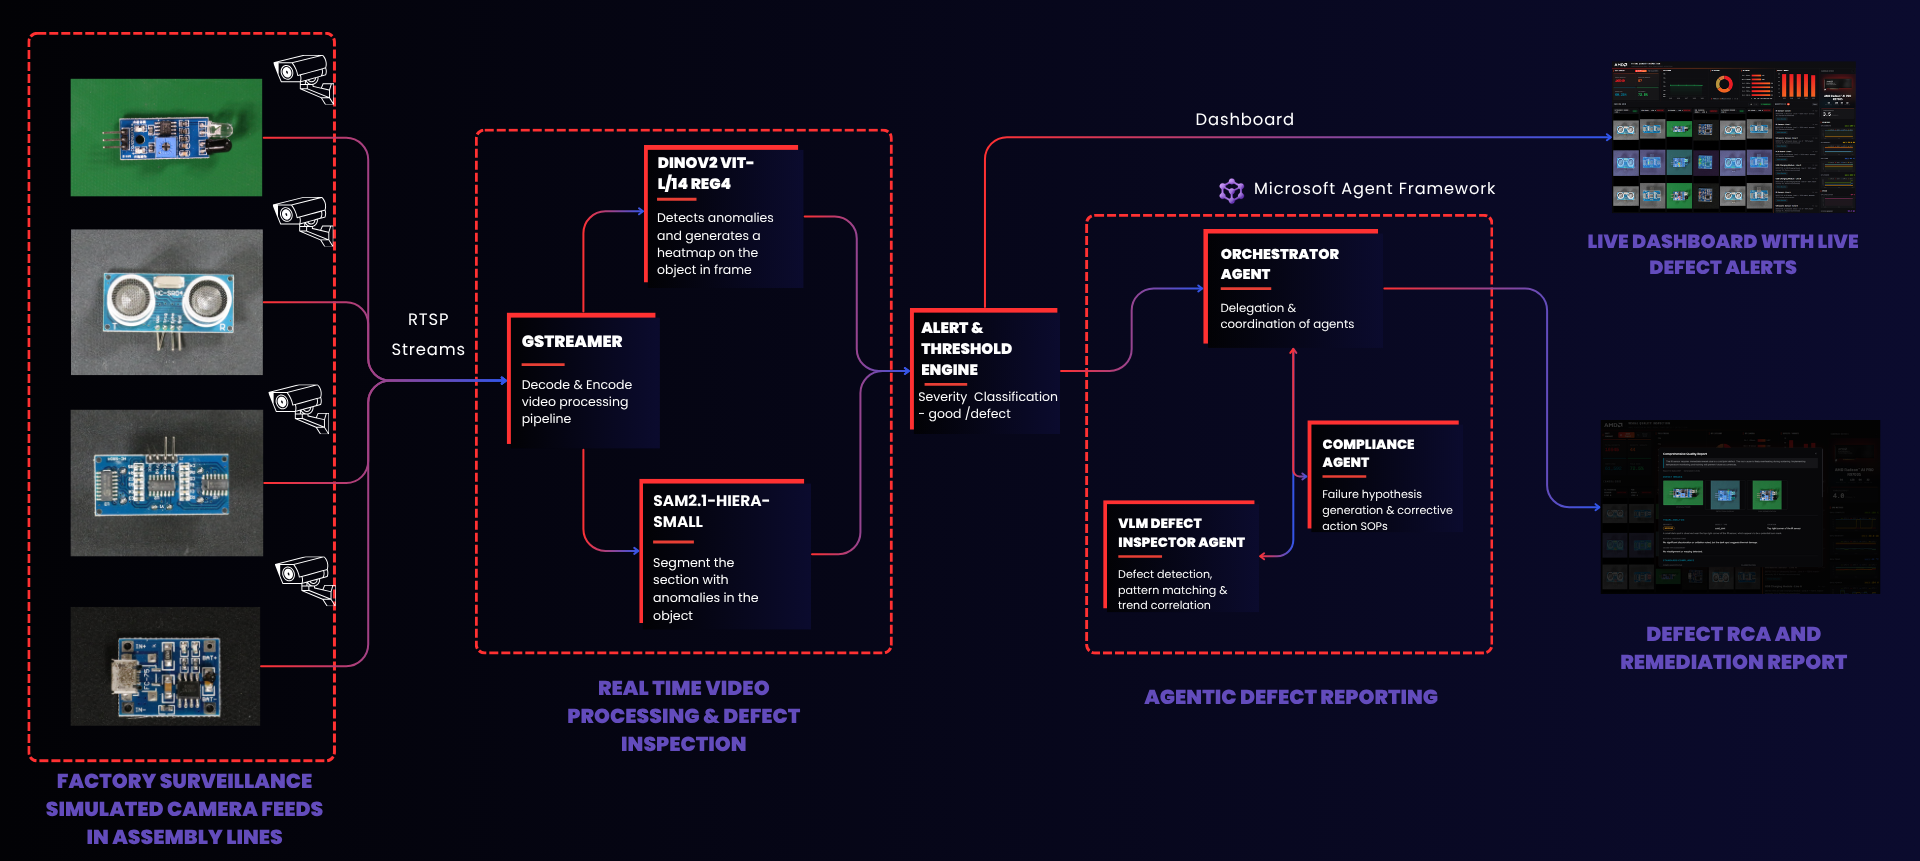
Figure 2. Solution workflow, from factory camera feeds through detection and segmentation to the agent-authored remediation report
The reporting path is what closes the loop between a rejected board and a process change. An operator opens a defect, and the pipeline streams its progress through characterization, standards retrieval, and compilation. The result is a structured report naming the defect, the standard it violates, the probable root cause, the corrective action, and the escalation path.
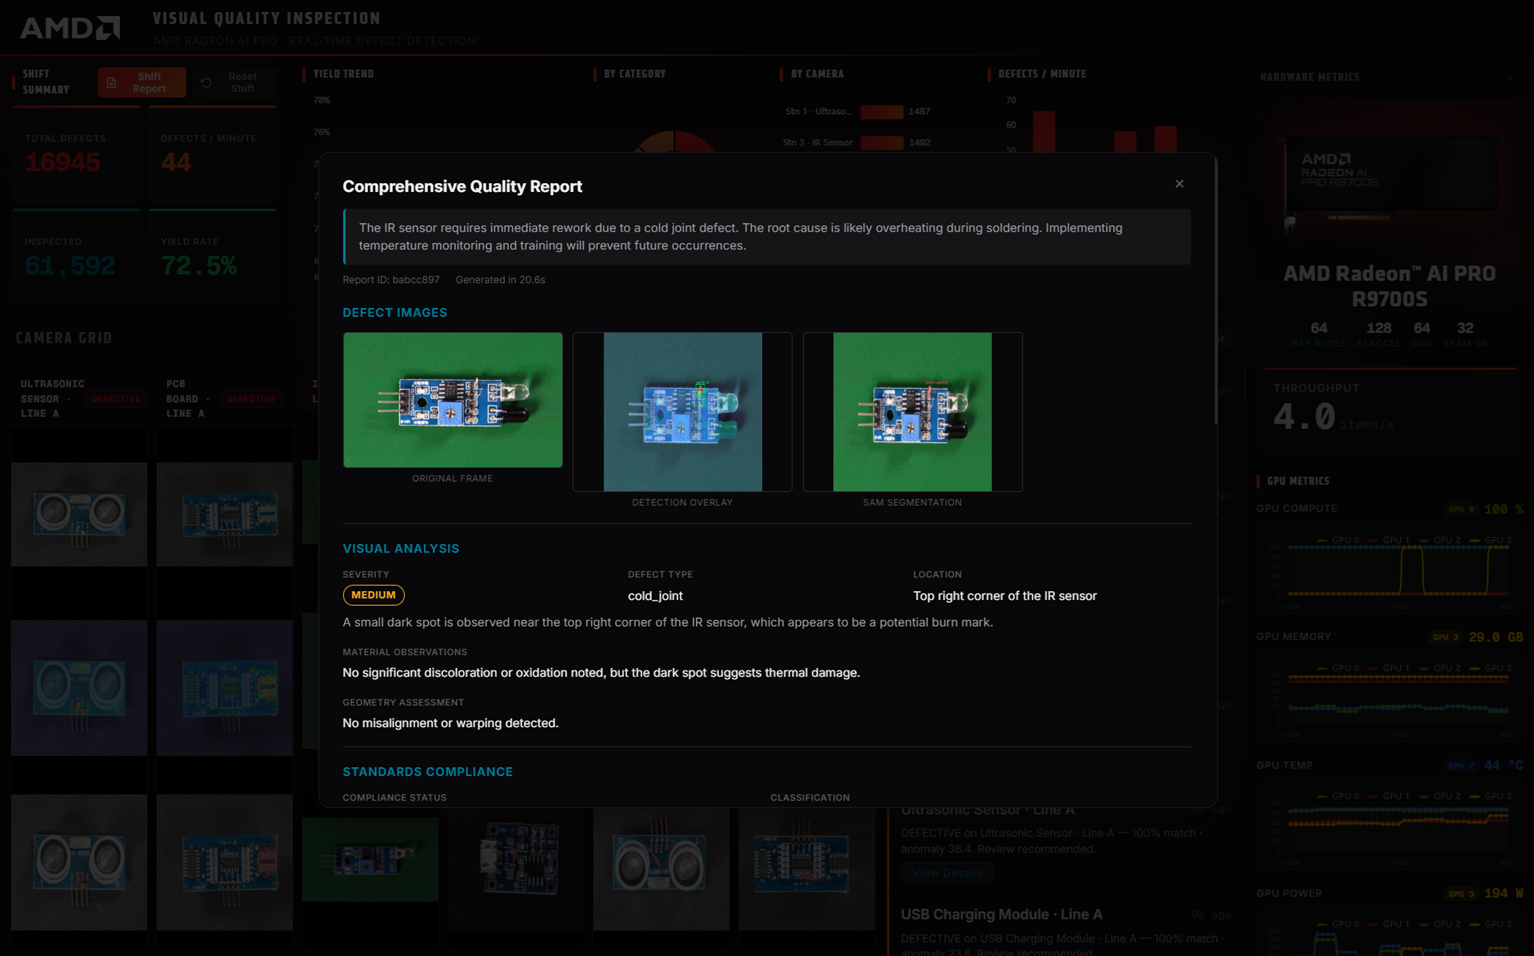
Figure 3. The quality report retrieves the applicable standard clauses and closes with corrective actions and escalation guidance
Simulated data. Report content shown is illustrative.
Solution Architecture
The architecture layers a computer vision pipeline, an alerting service, a local model serving tier, an agentic reasoning layer with standards retrieval, and a web dashboard on top of AMD ROCm™ and a containerized service stack. A relational database holds inspection history and a vector index holds the standards library. Every layer runs on the same local system, and the deployment uses standard container tooling so plant IT teams manage it with tools they already know.
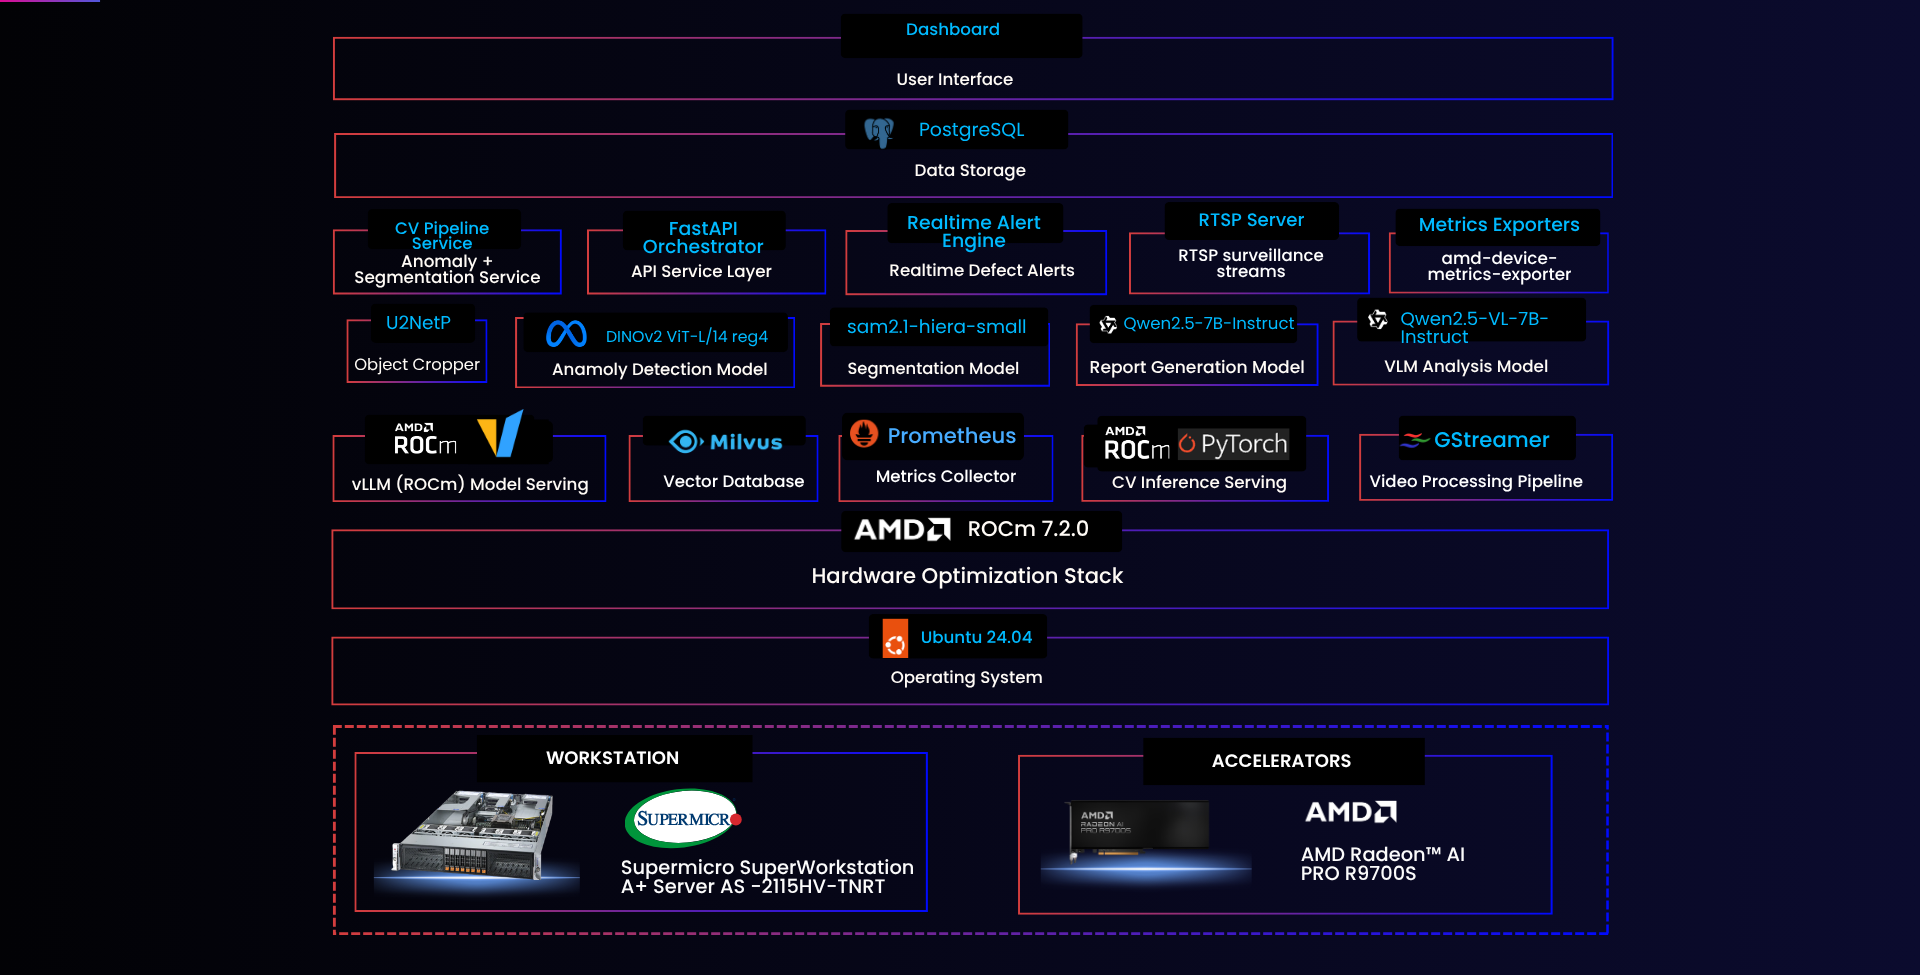
Figure 4. Solution architecture, from hardware and AMD ROCm through vision, model serving, agents, and dashboard
Reference Configuration
The following configuration is the recommended starting point for this workload and the system Metrum AI used for the demonstration described in this brief.
| Component | Specification |
|---|---|
| System platform | Supermicro SuperWorkstation A+ Server AS -2115HV-TNRT, 2U single-processor rackmount workstation with PCIe 5.0 |
| GPUs | 4 x AMD Radeon™ AI PRO R9700S, 32 GB per GPU |
| System memory | 256 GB DDR5. 128 GB is the minimum for the full feature set |
| Storage | 2 TB NVMe SSD |
| Operating system | Ubuntu 24.04.4 |
| GPU software stack | AMD ROCm™ 7.2 or later |
| Container runtime | Docker Engine and Docker Compose, versions per the repository prerequisites |
Table 3. Reference hardware and software configuration used for solution deployment and validation
Scaling by GPU Count
Setup detects how many GPUs are present and enables capability tiers accordingly. A line can therefore begin with detection and extend into analysis and reporting without changing the software deployment.
| Configuration | Capabilities Enabled |
|---|---|
| Two GPUs | Real-time anomaly detection and segmentation across all inspection stations, with the live dashboard and yield analytics. |
| Three GPUs | Adds vision-language defect analysis, so every flagged frame returns a plain-language assessment with root cause and corrective action. |
| Four or more GPUs | Adds the full agent pipeline for standards-grounded compliance reports and AI-analyzed shift summaries, both exportable as PDF. |
Table 4. Capability tiers by GPU count in the reference deployment
Business Outcomes
Manufacturers evaluate inspection technology on escape rate, cost of poor quality, and audit readiness. The solution addresses all three.
- Detection of failure modes nobody trained for. Anomaly-based detection scores deviation from good units rather than matching a fixed defect list, so a novel failure mode can surface on its first appearance rather than after the field returns arrive.
- Consistent decisions across every shift. The same model scores every frame at every station, removing the shift-to-shift and operator-to-operator variability that manual inspection cannot eliminate.
- Faster corrective action. A plain-language root cause and a recommended action arrive with the defect, so process adjustments do not wait for an engineer to work the problem from a score.
- Audit-ready quality records. Every report ties the defect to the station, the frame, and the specific standard clause, which shortens customer quality reviews and internal audits.
- Product design data stays in the plant. Inspection imagery never leaves the local system, and the deployment runs fully offline once model weights and container images are staged locally.
- Predictable economics. Inference runs on hardware the manufacturer owns, so cost does not scale with frame rate, station count, or per-inference cloud pricing.
Deployment Model and Next Steps
The solution deploys as a containerized stack on a single system. A guided setup routine checks prerequisites, detects the accelerator count, enables the matching capability tier, and starts every service. Manufacturers typically move through three phases.
- Validate. Stand up the reference configuration against footage from your own stations to confirm detection sensitivity, false positive rate, and segmentation quality for your product mix and lighting.
- Integrate. Connect live station cameras, then load your own workmanship standards and internal specifications into the retrieval index so reports cite the documents your auditors use.
- Scale. Extend coverage across additional stations and lines, tune thresholds per product category, and connect report output into your existing quality management system.
To scope a deployment for your line, or to arrange a technical walkthrough of the inspection and reporting views, contact Metrum AI or your AMD and Supermicro account teams.
Appendix A: Agent Pipeline Detail
The compliance reporting pipeline runs three agents in sequence, and the dashboard streams each stage as it completes. Each agent holds a narrow scope and a defined data source, which keeps the report traceable to specific evidence and specific standard clauses.
| Agent | Role |
|---|---|
| Vision Analyst | Characterizes the defect from the captured frame and the full detection context, including anomaly score, flagged regions, and product category. |
| Standards Agent | Retrieves the relevant excerpts from the indexed workmanship and tolerance standards, then assesses the finding against them to identify compliance gaps. |
| Report Compiler | Synthesizes both sets of findings into a structured report covering root cause analysis, corrective actions, and escalation guidance, then renders the downloadable PDF. |
Table 5. Agent roles in the on-premises quality reporting pipeline
Operators can also request analysis without the full pipeline. The vision-language model returns severity, defect type, root cause, location, and recommended action directly in the alert detail view, with a retry control if a request fails.
References
| 1. | AMD. "AMD Radeon AI PRO R9700 Graphics." https://www.amd.com/en/products/graphics/workstations/radeon-ai-pro/ai-9000-series/amd-radeon-ai-pro-r9700.html |
| 2. | AMD. "AMD ROCm Documentation." https://rocm.docs.amd.com |
| 3. | Supermicro. "SuperWorkstation A+ Server AS -2115HV-TNRT." https://www.supermicro.com/en/products/system/superworkstation/2u/as-2115hv-tnrt |
| 4. | IPC. "IPC-A-610, Acceptability of Electronic Assemblies" and "IPC J-STD-001, Requirements for Soldered Electrical and Electronic Assemblies." https://www.ipc.org |
| 5. | International Organization for Standardization. "ISO 2768, General Tolerances." https://www.iso.org |
| 6. | Metrum AI. Manufacturing Quality Inspection solution repository documentation and release notes. |
| 7. | Image sources: inspection dashboard and report captures from the solution repository. Product imagery courtesy of AMD and Supermicro. |
Disclaimers
Performance
Performance varies by hardware and software configuration, including testing conditions, system settings, application complexity, data quantity, batch sizes, software versions, and libraries used. Any performance figures referenced in this document are provided for informational purposes only and should not be interpreted as a guarantee of actual performance.
Model Performance Limitations
This solution is a technology demonstration validated against the sample PCB inspection footage and reference content bundled with the solution repository. Those clips represent the product categories, camera angles, and defect types for which the detection, segmentation, and reporting pipeline has been evaluated and tuned. For other footage or external camera streams, accuracy is not guaranteed and the system may produce missed detections, false positives, spurious alerts, or compliance output that does not reflect real conditions. Results should be treated as indicative rather than authoritative, and the solution should not be used as the sole basis for a release or rejection decision without human review.
Data and Standards
The demonstration videos, images, and standards documents bundled with the solution were synthetically generated or curated solely to demonstrate the pipeline. They do not represent real production footage, certified inspection data, or authoritative regulatory guidance. Standards excerpts used in demonstrations are illustrative and are not a substitute for the licensed published standards. Manufacturers should load their own licensed standards and internal specifications before relying on generated compliance output, and should confirm that any automated inspection record satisfies their own quality management and customer audit requirements. All materials are supplied as-is without warranties of any kind.
AMD, the AMD Arrow logo, Radeon, ROCm, and combinations thereof are trademarks of Advanced Micro Devices, Inc. Supermicro, SuperWorkstation, and A+ Server are trademarks or registered trademarks of Super Micro Computer, Inc. IPC and IPC-A-610 are trademarks of IPC International, Inc. ISO is a trademark of the International Organization for Standardization. All other product names are used for identification purposes only and may be trademarks of their respective owners.
METRUM AI INC. 2026 © All rights reserved.