Measured on Solidigm™ D7-PS1010 and D5-P5336 NVMe SSDs with vLLM and LMCache
Executive Summary
Coding agents pay for the same work over and over. Every task in this workload reads 62,000 to 152,000 tokens of repository context before it writes a line, and the model turns that context into an attention state, the KV cache, that is evicted when other work needs the memory. Once it is gone, the next request about the same repository rebuilds it from scratch. With GPU memory alone, every return visit paid that rebuild again in GPU prefill time: 13.76 seconds on average before the first token, for repository context the node had already processed once. That wait lands on the developer, and the GPU time behind it is capacity the node cannot spend on new work.
KV cache offload to NVMe SSDs turns that rebuild into a reload. Persisting KV cache through vLLM and LMCache (an open-source KV cache offload library) on a Solidigm D7-PS1010 performance tier or a Solidigm D5-P5336 capacity tier writes the attention state once to a tier shared by every replica on the node, and LMCache reloads it the next time the same repository context appears. On the return visit, the first token came back 6.7x faster on the Solidigm D7-PS1010 and 4.4x faster on the Solidigm D5-P5336 than with GPU memory alone. The replay is arranged so that each prompt returns after about 490 GB of other KV has passed through the node, beyond what GPU memory or host DRAM can hold, so the result measures the long-distance reuse a storage tier exists to serve.
This paper presents results from an eight-run benchmark on a four-GPU agentic inference node. Sixty long-context coding tasks, 62,000 to 152,000 tokens each, were run under three configurations: GPU memory only (the control), GPU memory plus a Solidigm D7-PS1010 TLC tier, and GPU memory plus a Solidigm D5-P5336 QLC tier. Each run makes two passes over the same sixty tasks. The first visit starts from an empty tier and is designed to compute the KV cache for every prompt; the return visit asks the same questions again.
On the return visit, the Solidigm D7-PS1010 tier returned the first token in 2.05 seconds against 13.76 seconds with GPU memory alone, and 96.7% of tasks landed inside a five-second target that GPU memory alone met on none. The Solidigm D5-P5336 returned it in 3.10 seconds, with 83.3% inside the target, from a single 122.88 TB drive with eight times the capacity of the tested D7-PS1010. One shared tier held 498 GB of KV cache after a first visit, more than the node's 384 GB of GPU memory, and LMCache reported a 99.8% aggregate hit rate on the return visit with hits on all four replicas. Writing that KV during the first visit kept first-visit time to first token within 1.2% of GPU memory only in the median run. On the return visit, 15 of 360 requests on the Solidigm configurations returned an empty completion; they count as misses in the five-second shares and are excluded from time-to-first-token statistics. Counted as full recomputes instead, every Solidigm run still returns the first token several times faster than GPU memory alone.
All results derive from eight runs on a single model at a fixed concurrency of four, executed through the demo dashboard on the stack described under Benchmark Methodology (vLLM, LMCache, NVIDIA RTX PRO 6000 Blackwell Server Edition GPUs, Solidigm NVMe SSDs). They characterize that configuration and will vary with configuration changes; they are not a guarantee of performance on a different system or workload.
Key Results at a Glance
The Hidden Tax on Agentic Inference
Every large language model builds an attention state called the KV cache as it processes input context [1]. During prefill, the model computes the per-layer key and value tensors for each token in the prompt. During decode, it reuses those cached tensors instead of recomputing them for every new token it generates. Prefill is where a long context is paid for, and the bill scales with the length of the prompt; at these lengths the attention computation, which grows with the square of the prompt, dominates.
A coding agent is a clear case. Before it can suggest a change, it reads the issue and the repository source that make up its working context. For the workload measured here, sixty coding tasks whose contexts run from 62,000 to 152,000 tokens, time to first token (TTFT) on the first visit is about 13.5 seconds (13.46 to 13.66 s across configurations) with four concurrent clients on four NVIDIA RTX PRO 6000 Blackwell Server Edition GPUs [2]. That is the wait before the first character of the answer appears.
GPU memory cannot hold that state for long. Each of the four replicas runs on its own 96 GB GDDR7 GPU [2], and the model weights, activations and in-flight batches take their share first. At the run's memory setting each GPU had about 53 GiB free for KV cache. The sixty contexts in this workload wrote 498 GB of KV to the tier, about 8.3 GB per task on average. At a 9 GB planning figure, the value used for capacity estimates throughout this paper, each GPU holds about six of them. Once the four replicas have moved through enough other tasks, the state is gone, and the next question about the first repository starts over.
The control runs make the cost concrete. When KV lives only in GPU memory, asking the same sixty questions a second time costs 13.76 seconds to first token, within 2% of the first visit. Nothing was saved. Half the tasks waited more than 13 seconds, the slowest 5% waited more than 23, and not one task in either control run returned a first token within five seconds. With KV in GPU memory alone, the prefill is the same computation, performed twice, for an identical prefix.
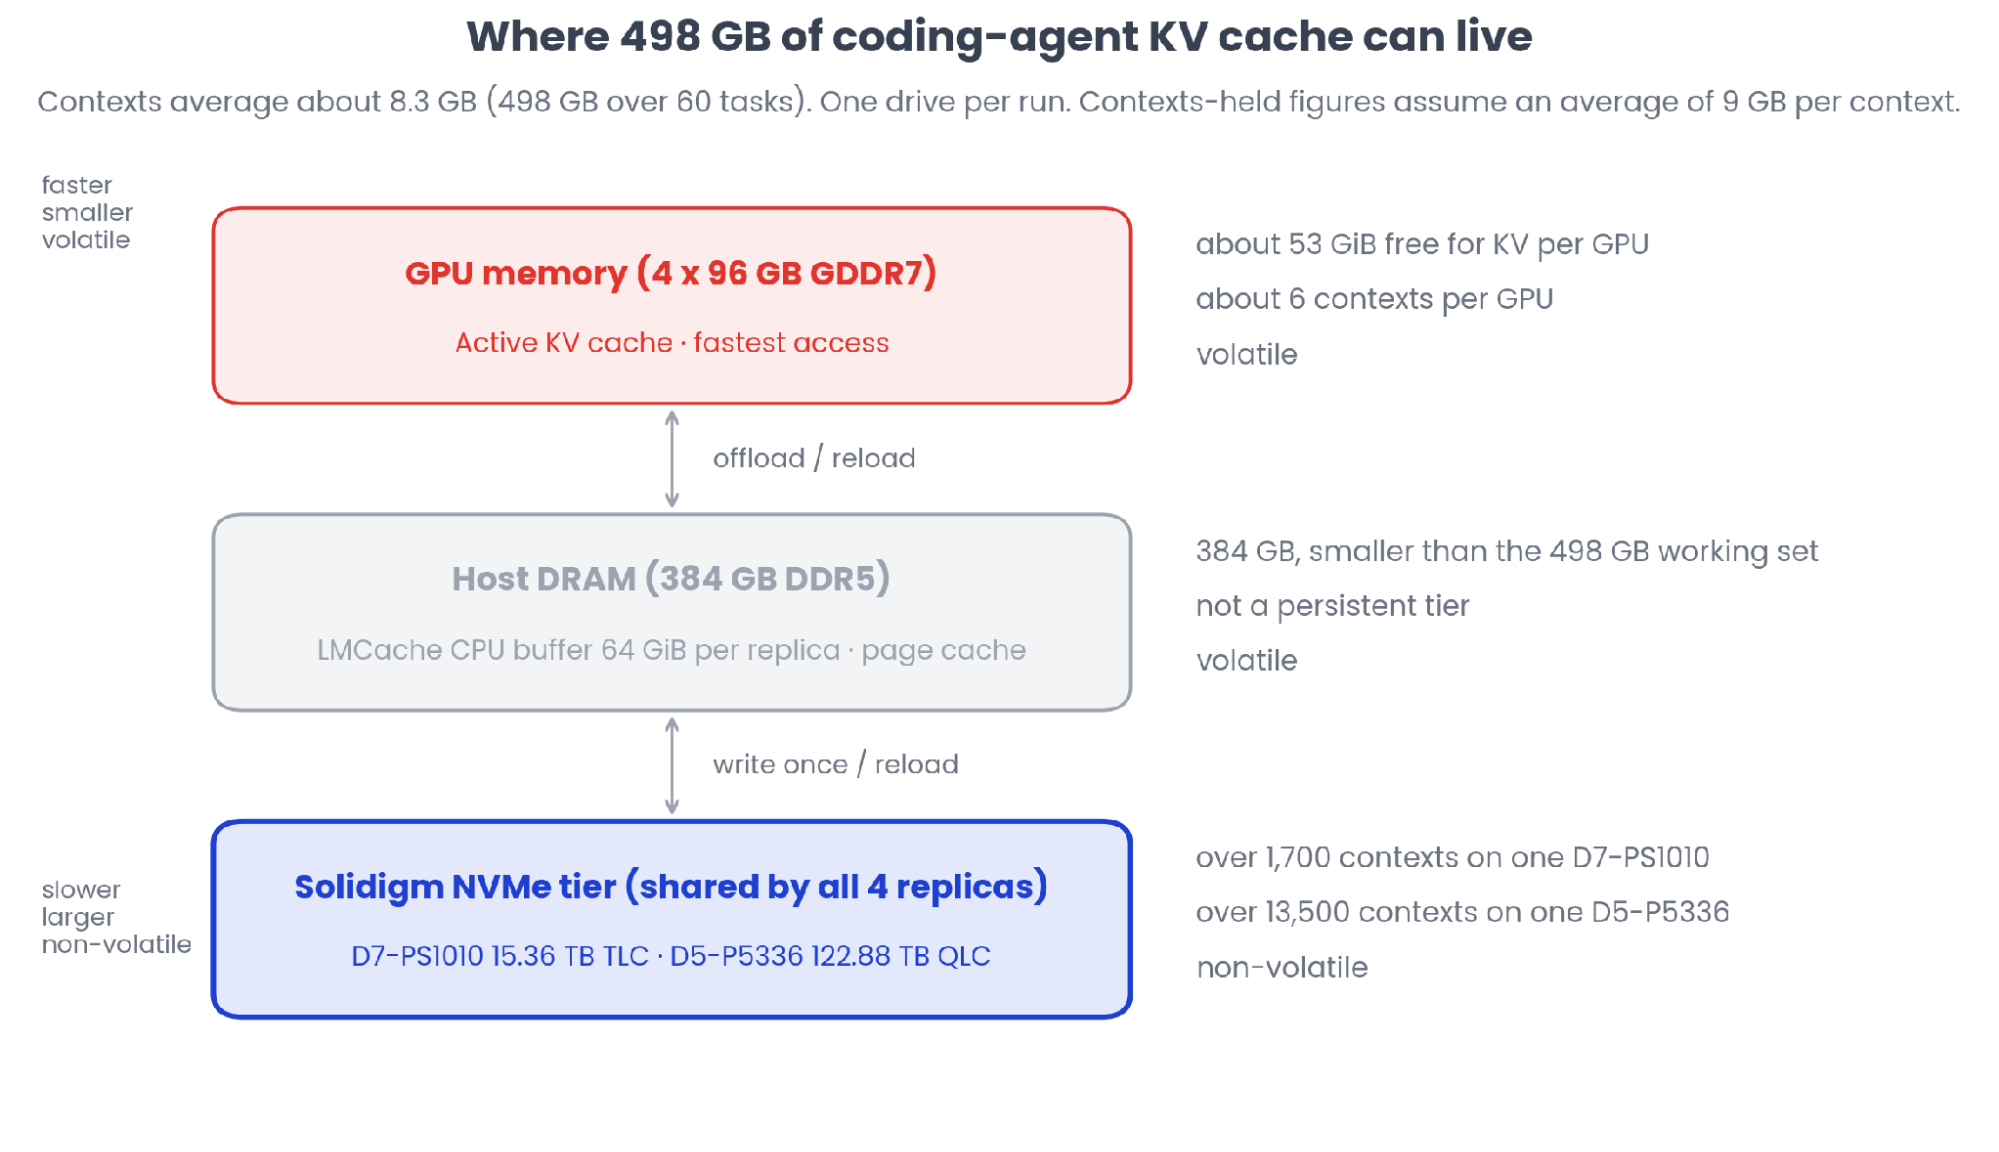
Figure 1 | Where 498 GB of Coding-Agent KV Cache Can Live: GPU Memory, Host DRAM and the Solidigm NVMe Tier
The arithmetic in Figure 1 is the argument for a storage tier. Sixty tasks' worth of KV already exceeds the node's total GPU memory (384 GB) and its host DRAM (384 GB). Only about 212 GiB of that GPU memory (53 GiB per GPU) is free for KV cache at this memory setting, less than half the working set. At the 9 GB planning figure, one 15.36 TB Solidigm D7-PS1010 holds over 1,700 such contexts; one 122.88 TB Solidigm D5-P5336 holds over 13,500. These capacity figures are estimates that assume a full, managed tier. LMCache's fs:// backend has no capacity limit or eviction, so a full drive was not tested; these runs used about 0.4% of the D5-P5336 and 3% of the D7-PS1010, and follow-up runs at higher fill levels are planned. For fleets of coding agents working a stable set of repositories, prefill of the same context recurs whenever the working set outgrows GPU memory, and each recurrence costs GPU time and first-token latency.
Persist the Work, Skip the Recompute
KV cache data does not need to live exclusively in GPU memory. By extending the memory hierarchy to include NVMe SSD storage, the inference system persists computed KV blocks instead of discarding them. When the same repository context is needed again, the system reloads cached blocks through LMCache rather than recomputing them on the GPU. The GPU computes what is new and loads the rest.
A Shared Tier for Every Replica on the Node
The node measured here (Figures 2 and 3) runs four vLLM replicas behind a single nginx gateway, all four connected through LMCache [3] to one shared directory on a Solidigm drive that every replica reads and writes, with every replica deriving the same cache keys. Connector and backend settings are listed under Benchmark Methodology.
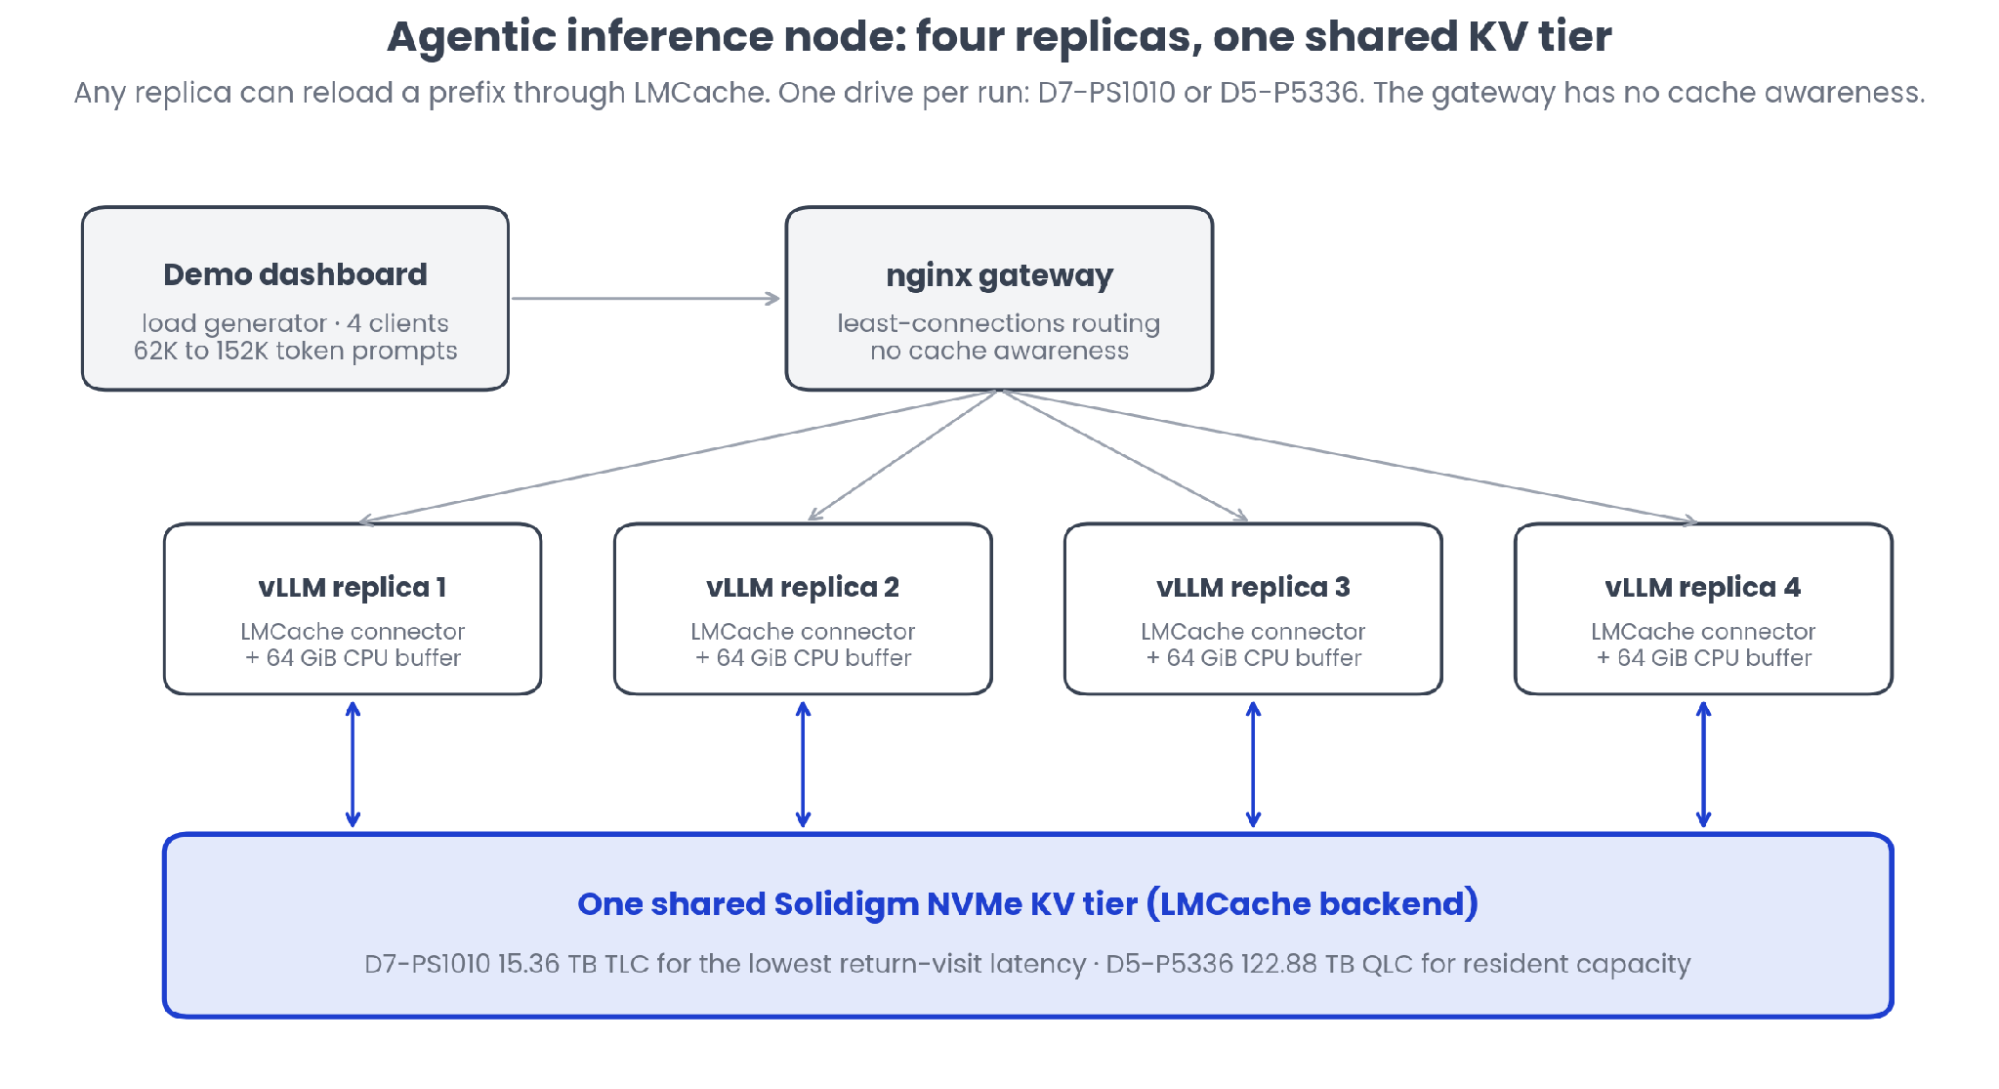
Figure 2 | Agentic Inference Node: Four vLLM Replicas, One Shared Solidigm KV Tier (one drive per run)
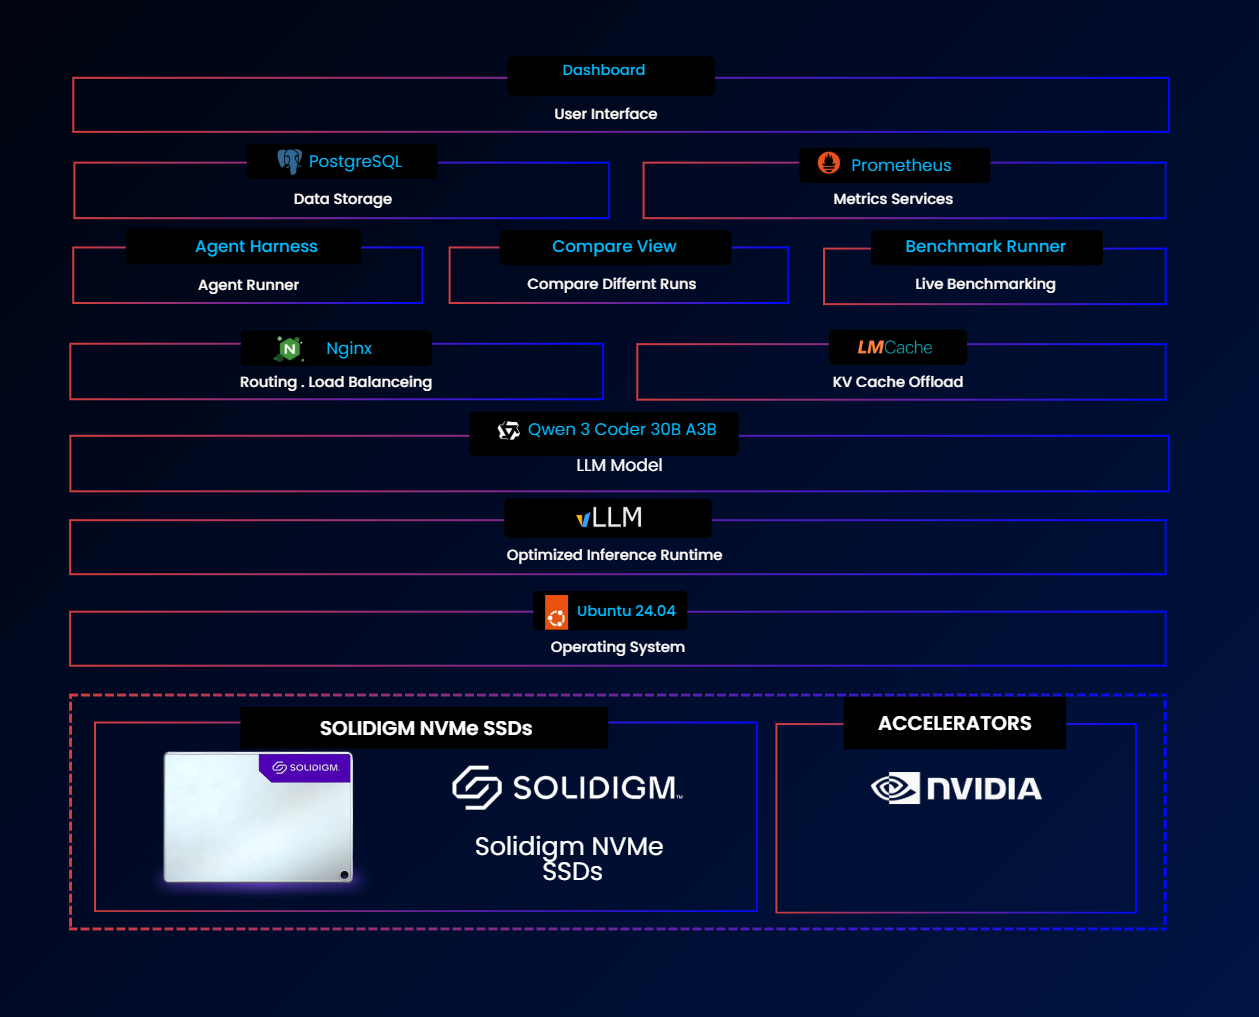
Figure 3 | Technical Architecture of the Agentic Inference Node
Three properties of this design matter for a multi-replica node rather than a single process.
The tier is shared. The gateway routes by least connections and has no knowledge of which replica computed which prefix. A per-replica cache helps only when a returning request happens to land on the replica that saw it first. A per-process disk cache, such as LMCache's local_disk backend, does not solve this, because one replica cannot see KV another has written. With the shared fs:// backend, a lookup is answered from the shared directory rather than from an index inside one process, so a prefix written by any replica can be reloaded by any other. In every Solidigm run, all four replicas served cache hits, and LMCache reported a 99.8% aggregate hit rate on the return visit.
The tier is non-volatile by design. Unlike DRAM, the drive retains the KV it holds across replica restarts and power cycles, and because the shared backend keeps no in-process index, the stored cache is not tied to the life of any one replica. Reloading after a restart was not measured in this benchmark; each run starts from an empty tier.
The tier is large. One drive holds 15.36 TB (D7-PS1010) or 122.88 TB (D5-P5336). At 384 GB, host DRAM is smaller than this workload's 498 GB working set; one drive holds it many times over.
The Storage Foundation
The hardware foundation is the Solidigm D7-PS1010 (15.36 TB, PCIe® 5.0, TLC NAND) [4] and the Solidigm D5-P5336 (122.88 TB, PCIe 4.0, QLC NAND) [5], providing a performance tier and a capacity tier for KV cache offload.
The Solidigm D7-PS1010 is the performance tier: PCIe 5.0 TLC that delivered the lowest return-visit latency in these runs, 2.05 seconds to first token, for interactive agents where the first token is what the developer is waiting on. The Solidigm D5-P5336 is the capacity tier: 122.88 TB of QLC in a single U.2 drive, eight times the capacity of the tested D7-PS1010, that still returned the first token 4.4x faster than GPU memory alone at the same 99.8% hit rate. One D5-P5336 is estimated to hold over 13,500 contexts of this workload, so far more sessions stay resident before anything has to be evicted. Both were measured under the same workload, one drive per run, in the same node.
The Solution in Action
The runs in this paper were driven from the demo dashboard of Shared KV Cache for Coding Agents, a demonstration harness built by Metrum AI for this project and used for live demonstrations of this solution. One screen configures the node, launches the task set, watches each pass as it executes, and compares a completed run against the others.
One screen for the system under test. The dashboard opens on the node itself: the four NVIDIA RTX PRO 6000 Blackwell Server Edition GPUs, the AMD EPYC host and its 384 GB of memory, the model under test (Qwen3-Coder-30B-A3B-Instruct-FP8 at a 262,144-token context), and the two Solidigm tiers in the KV path: the Solidigm D7-PS1010 as the performance tier and the Solidigm D5-P5336 as the capacity tier. A run is launched from here against the sixty-task workload, in either the GPU-memory-only, D7-PS1010 or D5-P5336 configuration.
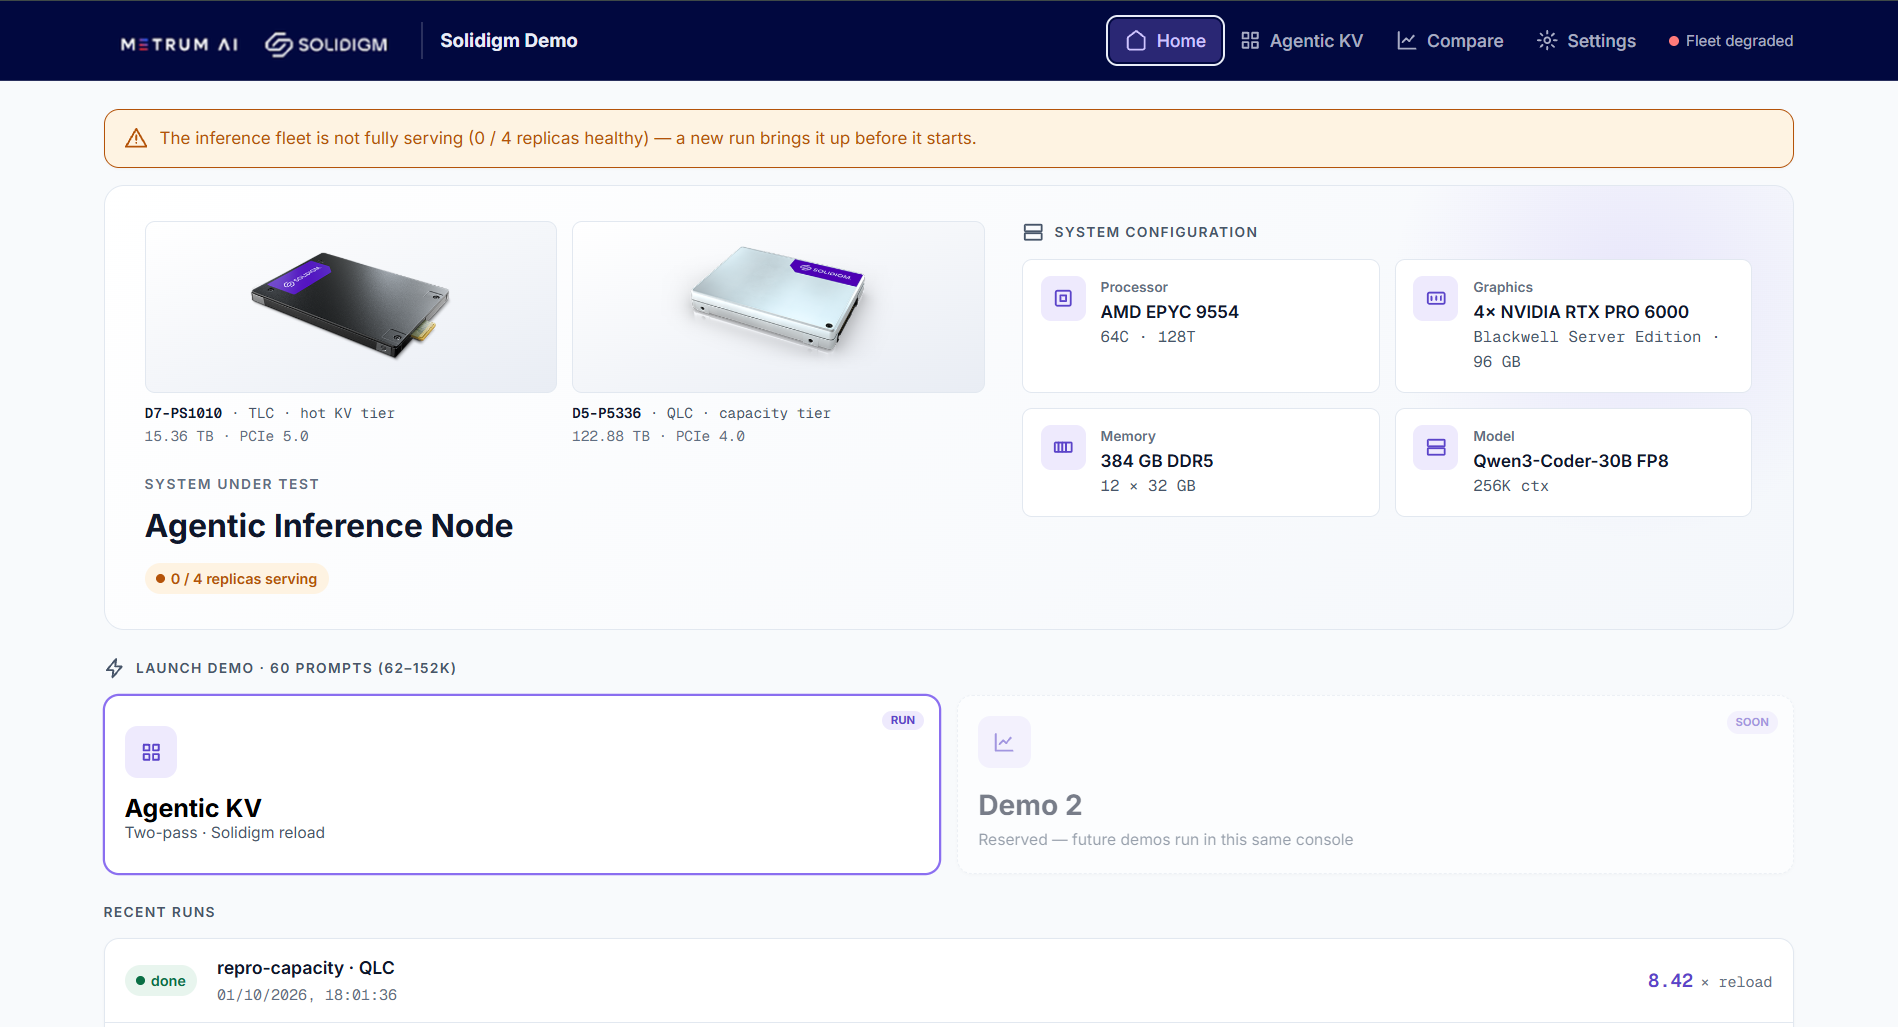
Figure 4a | Shared KV Cache for Coding Agents Demo Dashboard
A run, measured as it executes. Each run has its own report. It states the one number the developer waits on, the return-visit time to first token, beside the reload factor (first visit ÷ return visit, per task), the share of return-visit tasks inside the five-second target, the KV cache resident on the Solidigm tier, and the measured drive read bandwidth. Three time series recorded live during the passes make the mechanism visible: drive read bandwidth spiking as the return visit reloads KV from the tier, GPU utilization and board power across both passes, and GPU memory residency on the four replicas. A per-task table lists all sixty tasks by context length with their first-visit and return-visit time to first token. On the Solidigm D7-PS1010, this is where the return visit reads 2.05 s to first token against 13.76 s with GPU memory only, a 6.7x reduction, with 96.7% of tasks inside five seconds and 498 GB of KV cache resident on one shared tier.
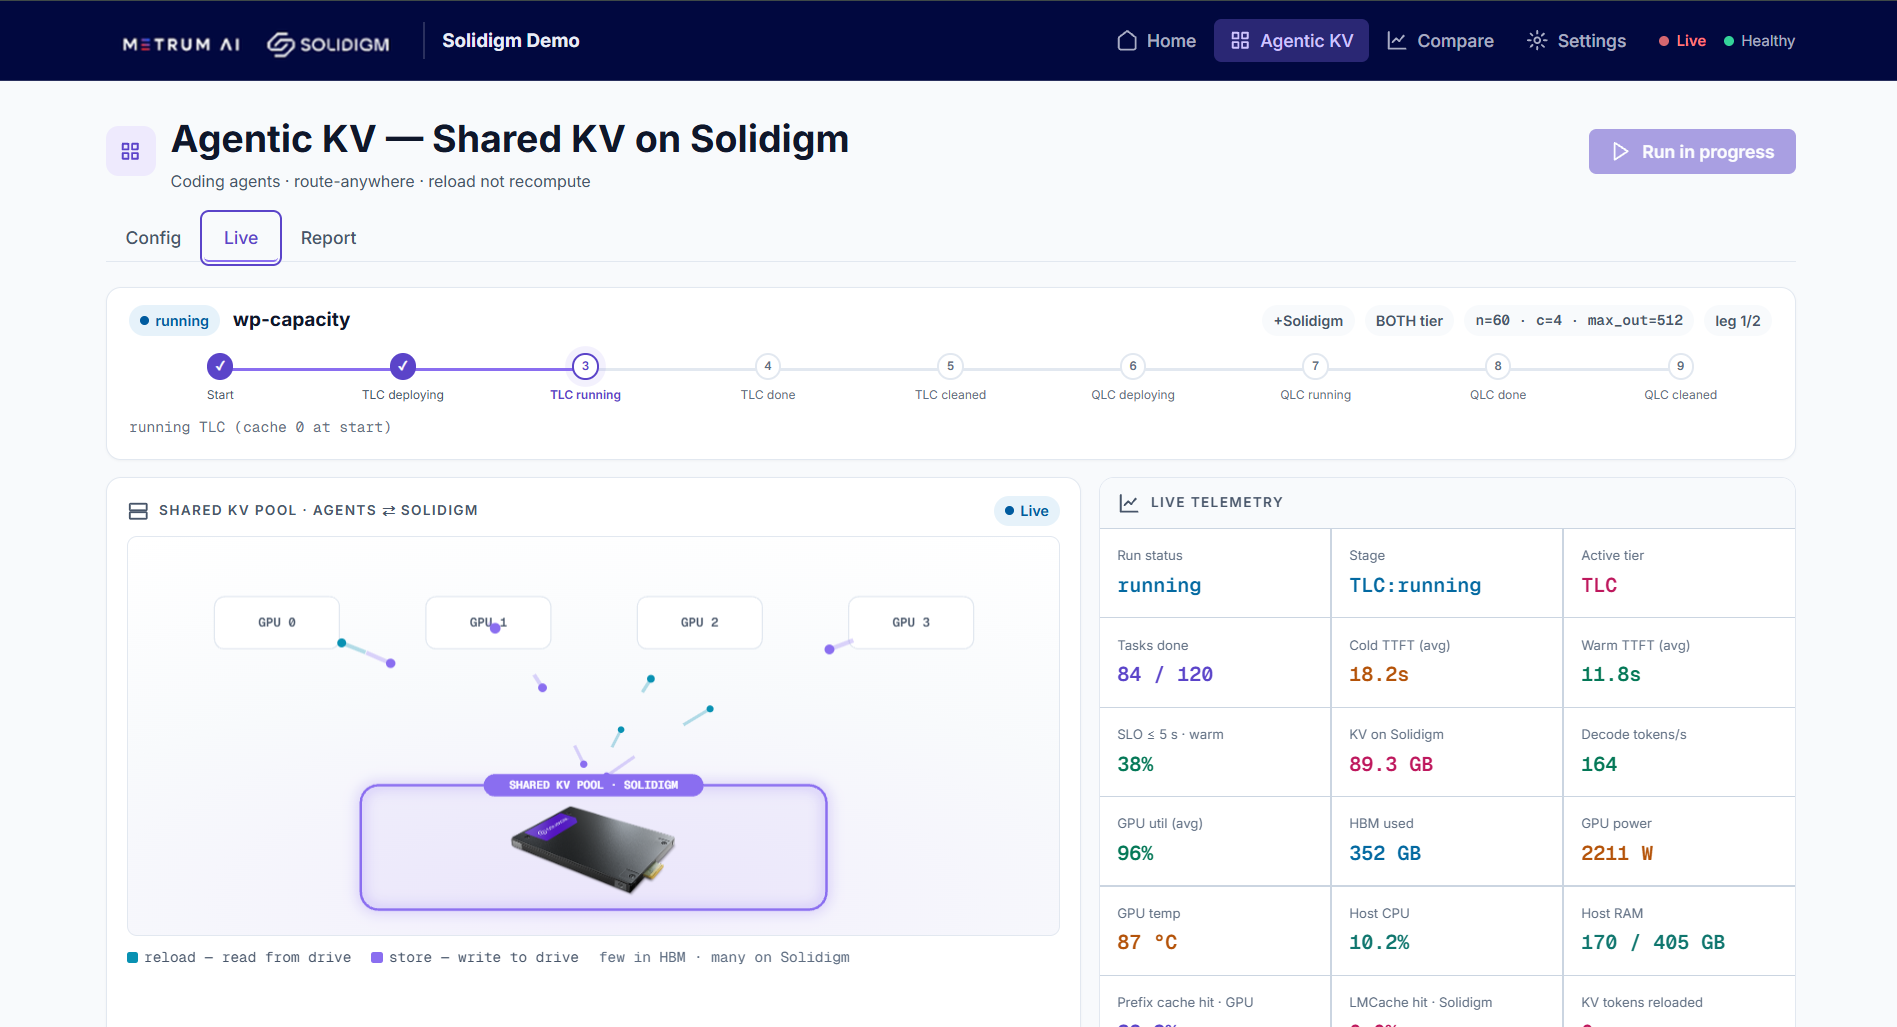
Figure 4b | Live Benchmark Page
Both backends, side by side. The compare view holds the workload and concurrency fixed and makes the KV backend the only variable, putting GPU memory only, the Solidigm D7-PS1010 tier and the Solidigm D5-P5336 tier head to head on the same pass of the same sixty prompts. It is the dashboard rendering of this paper's central result: GPU memory alone recomputes every prefix and returns the first token in 13.76 s, meeting the five-second target on none of its tasks; the Solidigm tiers reload instead of recompute and return it in 2.05 s (D7-PS1010) and 3.10 s (D5-P5336), both at a 99.8% LMCache hit rate with hits on all four replicas. The same view also compares the two Solidigm tiers directly (the performance tier against the capacity tier).
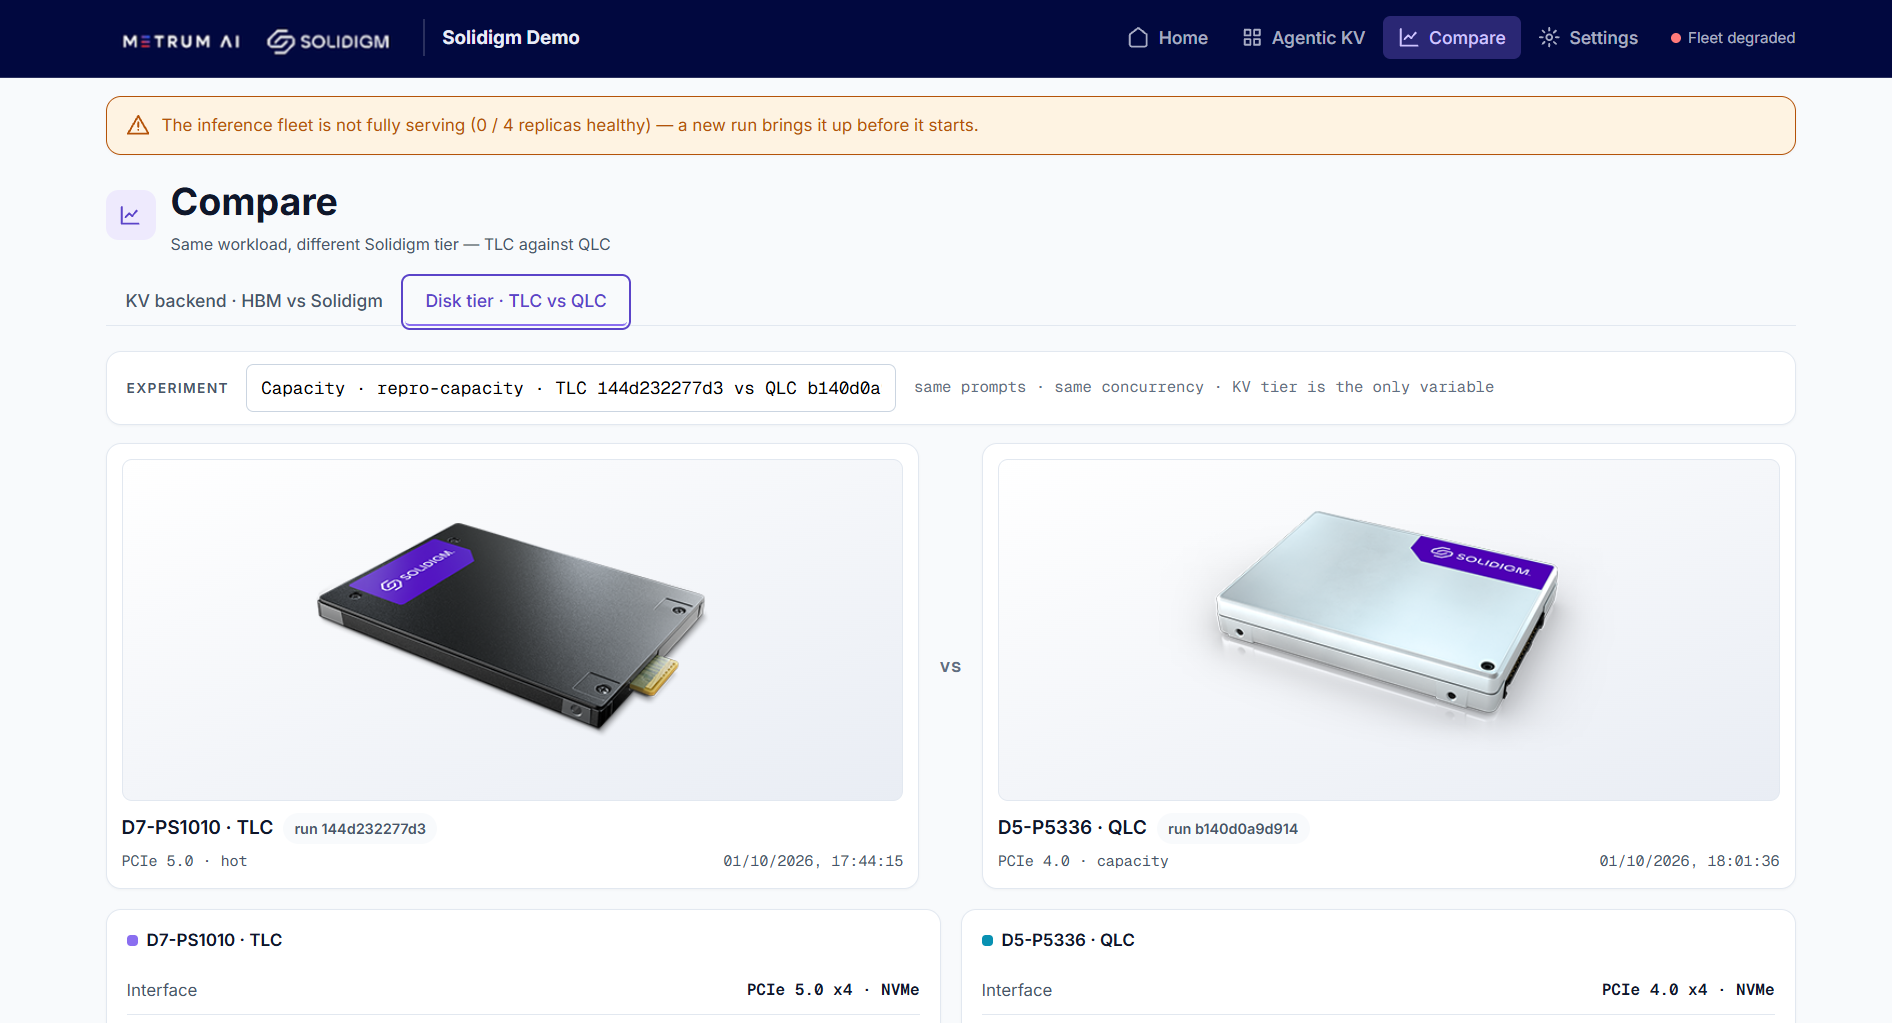
Figure 4c | Compare View Solidigm D7-PS1010 vs Solidigm D5-P5336 on One Matched Configuration
Benchmark Methodology
These results come from an eight-run benchmark executed through the demo dashboard described above. The numbers reflect that stack as configured below and will vary with configuration changes: model, context lengths, concurrency, cache settings, drive model and firmware, or software versions.
System Under Test
Tables 1 and 2 list the hardware and software configuration.
| Component | Specification |
|---|---|
| CPU | AMD EPYC 9554, 64 cores / 128 threads |
| Memory | 384 GB DDR5, 12 x 32 GB |
| GPU | 4 x NVIDIA RTX PRO 6000 Blackwell Server Edition, 96 GB GDDR7 each [2] |
| Storage (TLC) | Solidigm D7-PS1010, 15.36 TB, PCIe 5.0, U.2 15 mm (SB5PH27X153T), firmware G70YG252 [4] |
| Storage (QLC) | Solidigm D5-P5336, 122.88 TB, PCIe 4.0, U.2 (SBFPF2BV0P12), firmware 5DV10602 [5] |
| Filesystem for the KV tier | XFS on the whole D7-PS1010 and on one partition of the D5-P5336; mounted rw, noatime, nodiratime, inode64, logbufs=8, logbsize=32k (D5-P5336 also sunit=64, swidth=64) |
| Model | Qwen3-Coder-30B-A3B-Instruct-FP8, 262,144-token context window [6] |
| Inference runtime | vLLM 0.28.0, LMCache 0.5.4 [3], nginx gateway, 4 replicas |
| Operating system | Ubuntu 24.04.3 LTS, kernel 6.8.0-136-generic |
| GPU driver | NVIDIA 580.105.08 |
Table 1 | System Under Test
Inference and Cache Settings
| Setting | Value |
|---|---|
| vLLM tensor parallelism and replica placement | TP=1, one replica per GPU; each container pinned to one GPU |
| vLLM max-model-len | 262,144 |
| vLLM gpu-memory-utilization | 0.92 (about 53 GiB of KV cache per GPU) |
| vLLM automatic prefix caching | On, identical in all three configurations |
| vLLM chunked prefill / max-num-batched-tokens | On (default); 16,384 |
| KV cache dtype | BF16 (the FP8 checkpoint quantizes weights only) |
| LMCache connector and backend | LMCacheConnectorV1 (kv_role kv_both); fs:// remote backend, naive serializer, one directory per tier on the drive; PYTHONHASHSEED=0 on every replica so all replicas derive the same chunk keys |
| LMCache chunk size | 256 tokens |
| LMCache local CPU buffer | On, 64 GiB per replica |
| LMCache fs:// O_DIRECT | Off (buffered I/O; LMCache default, fs_connector_use_odirect not set) |
| Block-device read-ahead | 4,096 KB on both drives |
| Gateway routing | nginx, least connections |
Table 2 | Inference and Cache Settings
Workload
The benchmark used sixty synthetic software-engineering tasks in SWE-bench format, built from 35 public GitHub repositories at verified base commits. Each prompt is an issue statement plus the repository source the issue touches. This domain was selected because it produces long-context prompts whose expensive part, the repository, repeats from one request to the next. That pattern approximates a developer working a repository, or a code-review agent re-reading the same pull request each time a new comment lands. Table 3 lists the workload.
| Parameter | Value |
|---|---|
| Tasks | 60 synthetic software-engineering tasks in SWE-bench format, from 35 public GitHub repositories at verified base commits |
| Context per task | 62,000 to 152,000 tokens per task, as counted when the corpus was built |
| Output budget | 512 tokens per task (a cap); temperature 0, fixed seed |
| Concurrency | 4 clients in flight, least-connections routing across 4 replicas |
| Passes per run | 2: first visit (tier empty) and return visit (tier populated), both in the same order, longest context first |
Table 3 | Workload Configuration
How a Run Is Measured
Every run is two passes over the same sixty prompts, sent in the same order, longest context first.
Pass 1, first visit. The Solidigm tier is deleted and recreated, the replicas are restarted, and they come up against an empty cache. By design every prefix is computed and, in the Solidigm configurations, its KV is written to the tier. This is the cost of a first encounter.
Pass 2, return visit. The identical sixty prompts are replayed against the tier the first pass filled. Prefixes that can be reloaded are reloaded.
The primary comparison in this paper is the return visit across configurations: GPU memory only against each Solidigm tier, on the same pass of the same prompts. The control configuration is launched with no KV connector at all, so there is no code path by which KV could reach a drive; vLLM automatic prefix caching is on in the control as in the Solidigm runs, and the launch arguments are identical apart from the connector. A secondary check compares each configuration with itself. The reload factor is a task's first-visit time to first token divided by its return-visit time to first token: how many times faster the same request answers the second time (reported as the per-task median within each run, then the median across runs). A reload factor of 1.0 means nothing was reused.
Time to first token is the primary measurement because it is where prefill, the work KV cache offload removes, is paid. The 512-token output budget does not enter a request's own time to first token, though with four requests in flight it can affect queueing for others.
Because both visits send the sixty prompts in the same order, each prompt returns after about 490 GB of other KV has passed through the node. That is more than the node's GPU memory can hold, so the benchmark measures reuse beyond GPU capacity, the case a storage tier exists for. Reuse that returns within seconds to tens of seconds is served by GPU and host memory; the storage tier earns its place on longer-distance reuse like this, and the shared tier serves it from any replica without cache-aware routing. A live agent session reuses the repository content while the question changes. Prefix-based reuse holds only for content placed before the first change, so stable repository source must come before the issue or conversation, and reuse in a live session will be lower than the full-prompt replay measured here.
Benchmark Results
The Same Question, the Second Time
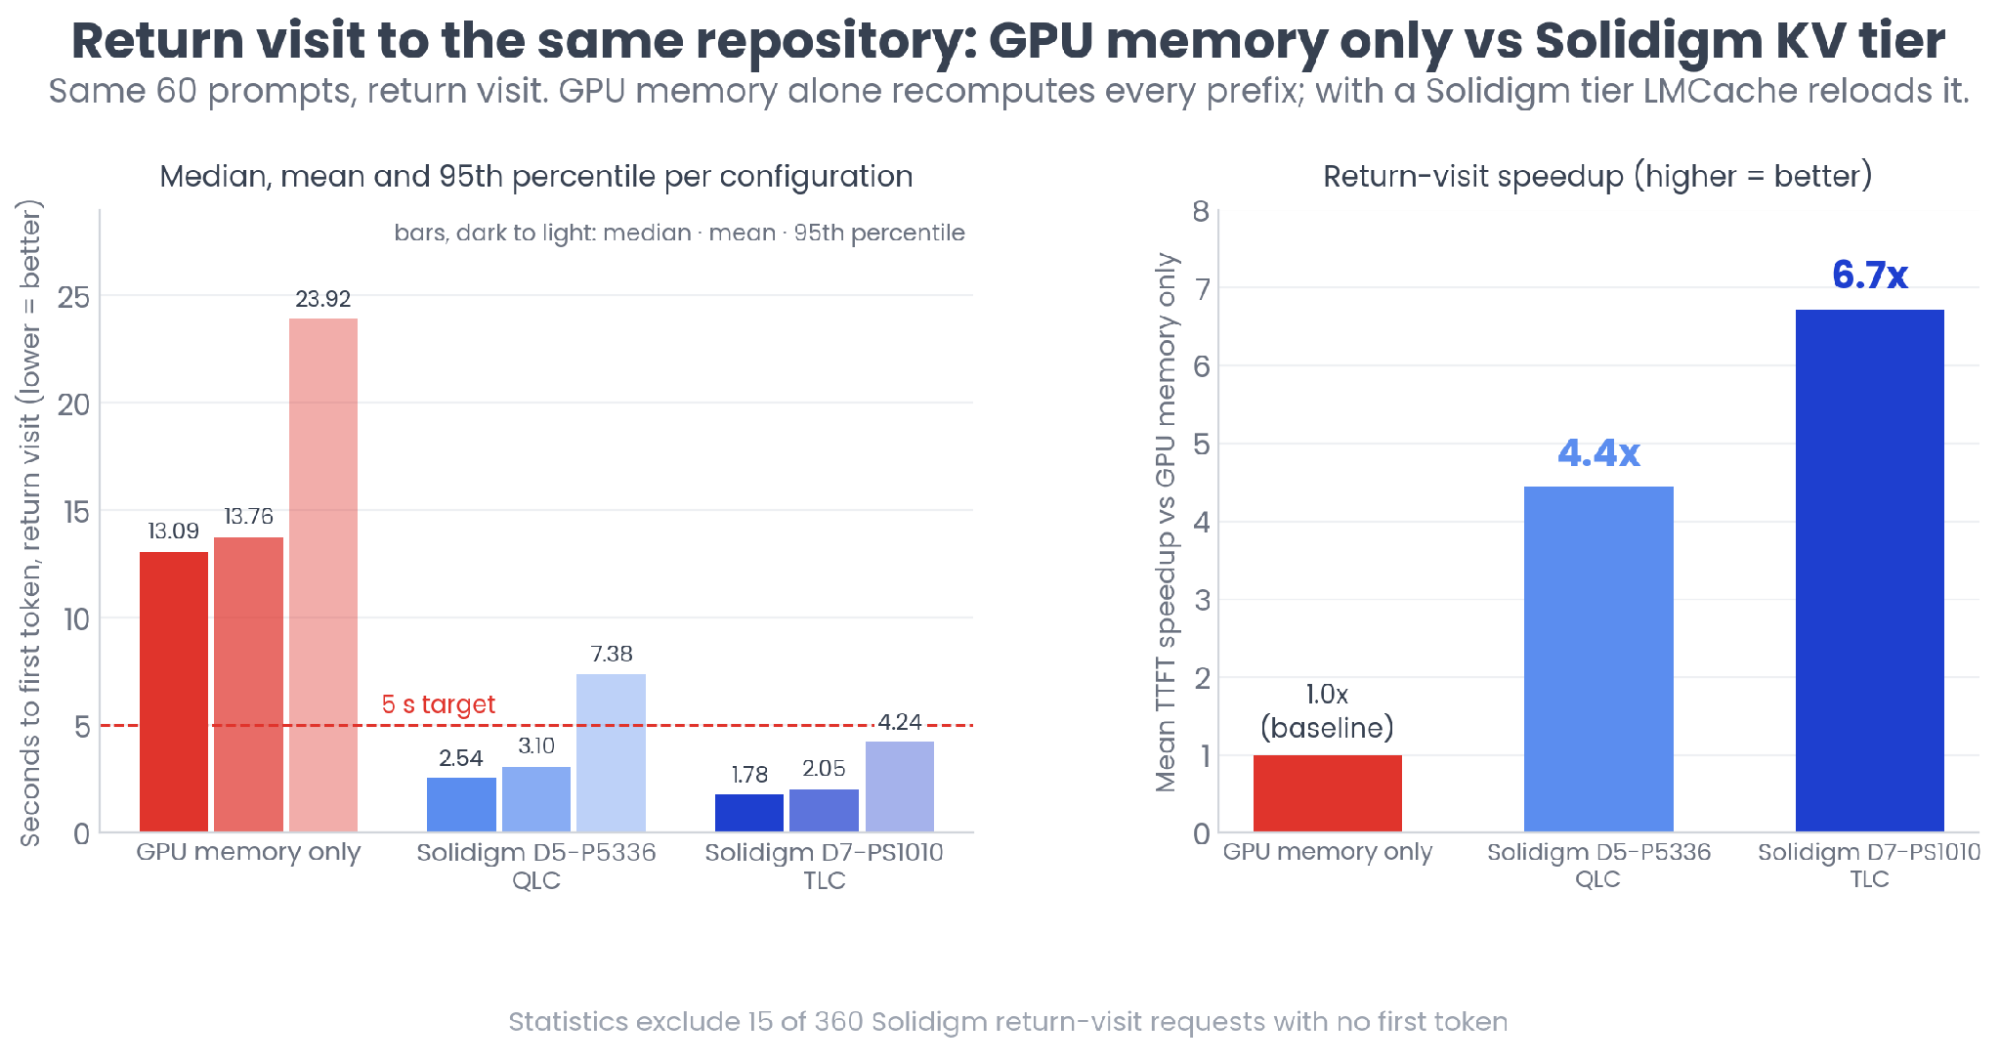
Figure 5 | Return-Visit Time to First Token and Mean Speedup vs GPU Memory Only
The left panel of Figure 5 is the central result. Asked the same sixty questions a second time, GPU memory alone recomputes every prefix and returns the first token in 13.76 seconds on average, 13.09 seconds at the median. The Solidigm D5-P5336 returns it in 3.10 seconds. The Solidigm D7-PS1010 returns it in 2.05 seconds: the same question, 6.7x sooner.
The right panel shows the ratios. Against GPU memory only, the return visit is 4.4x faster on the Solidigm D5-P5336 and 6.7x faster on the Solidigm D7-PS1010 on the mean. On the median the gap is wider: 5.2x and 7.4x (Table 4).
| Return visit | GPU memory only | Solidigm D5-P5336 (QLC) | Solidigm D7-PS1010 (TLC) |
|---|---|---|---|
| Runs | 2 | 3 | 3 |
| Time to first token, mean | 13.76 s | 3.10 s (4.4x) | 2.05 s (6.7x) |
| Time to first token, median | 13.09 s | 2.54 s (5.2x) | 1.78 s (7.4x) |
| Time to first token, 95th percentile | 23.92 s | 7.38 s (3.2x) | 4.24 s (5.6x) |
| Tasks with first token within 5 s | 0% (0 of 120) | 83.3% (50 of 60 in the median run) | 96.7% (58 of 60 in the median run) |
| Reload factor (first visit ÷ return visit, per-task median) | 0.98x (0.98 to 0.99) | 4.46x (4.36 to 5.02) | 6.58x (6.29 to 6.86) |
Table 4 | Return-Visit Results by Configuration
The run-to-run ranges do not overlap. Every D7-PS1010 run (reload factor 6.29x and above) is ahead of every D5-P5336 run (5.02x and below), and every D5-P5336 run exceeds both controls by more than fourfold. The same holds for return-visit time to first token and for tasks inside the five-second target: across those three measures, the ordering never inverts.
On the return visit, 15 of the 360 requests on the Solidigm configurations (6 on the D7-PS1010, 9 on the D5-P5336) returned an empty completion, against none of the 120 on GPU memory only and none on any first visit. These were not timeouts or errors: each completed within a few seconds with no output token. They count as misses in the within-5 s shares and are left out of the time-to-first-token statistics because they produced no first token. Charging each of them as a full recompute at its own first-visit time, the most conservative accounting, adds about 0.6 s to the D7-PS1010 return-visit mean and about 0.3 s to the D5-P5336 mean; every Solidigm run remains several times faster than GPU memory alone, and the ordering between the tiers is unchanged.
What the KV Cache Measurements Show
The latency numbers show that reuse worked. The cache measurements show that LMCache reloaded nearly every prefix (Table 5).
| Measure | GPU memory only | Solidigm D5-P5336 | Solidigm D7-PS1010 |
|---|---|---|---|
| KV cache written by a first visit from an empty tier | 0 GB | 498 GB | 498 GB |
| LMCache hit rate, return visit | n/a (no connector) | 99.84% | 99.83% |
| Replicas serving hits | n/a (no connector) | 4 of 4 | 4 of 4 |
| Peak read, drive under test | n/a | 5.84 GB/s | 6.45 GB/s |
| Bytes read, return visit (repeat run per tier) | n/a | 518 GB | 530 GB |
Table 5 | KV Cache Measurements (peak reads are 30-second averages, maximum over three runs)
Four observations follow.
498 GB is a storage-scale working set. Sixty coding tasks produced more KV than the node's GPU memory or host DRAM could hold.
A 99.8% aggregate hit rate means LMCache reloaded nearly all of every returning prompt, and every replica served hits. The small residual is the tail of each prompt that does not fill a complete 256-token chunk, which LMCache does not store in this configuration and the GPU recomputes. Because the return visit replays identical prompts, a hit rate this close to 100% is expected by design: it shows the tier served the replay, not the partial reuse a live agent session would see. With at most 255 tokens left unstored at the end of each prompt, prompts of 62,000 tokens and longer carry a hit-rate floor near 99.6% before any tier is measured.
The GPU-only control isolates the effect of the KV connector and tier. With no KV connector, its reload factor was 0.98x (the return visit ran about 2% slower than the first), it met the five-second target on 0 of 120 tasks, and the KV tier stayed empty (0 GB, Table 5), confirming the control never wrote KV to a drive. Because the control replayed identical prompts with vLLM prefix caching on, its flat result also shows that GPU-resident prefix caching recovered no measurable reuse in time to first token at this working-set size, and rules out warm-up or kernel and compile caching as the source of the Solidigm gains. The Solidigm configurations also run LMCache's 64 GiB CPU buffer per replica, which the control does not; device read counters recorded in a repeat run of each tier show the drive served at least as many bytes as were written on the return visit (Table 5), so the buffer and the page cache contributed little.
Each run touches one tier. The other is wiped at the start of every run and monitored throughout. On the D7-PS1010 runs the drive under test was read at up to 6.45 GB/s while the D5-P5336 read counter showed 0.01 GB/s; on the D5-P5336 runs the drive under test peaked at 5.84 GB/s while the idle D7-PS1010 read at most 0.001 GB/s. The figures attributed to each tier were produced with the other tier's drive essentially idle.
Inside the Five-Second Target
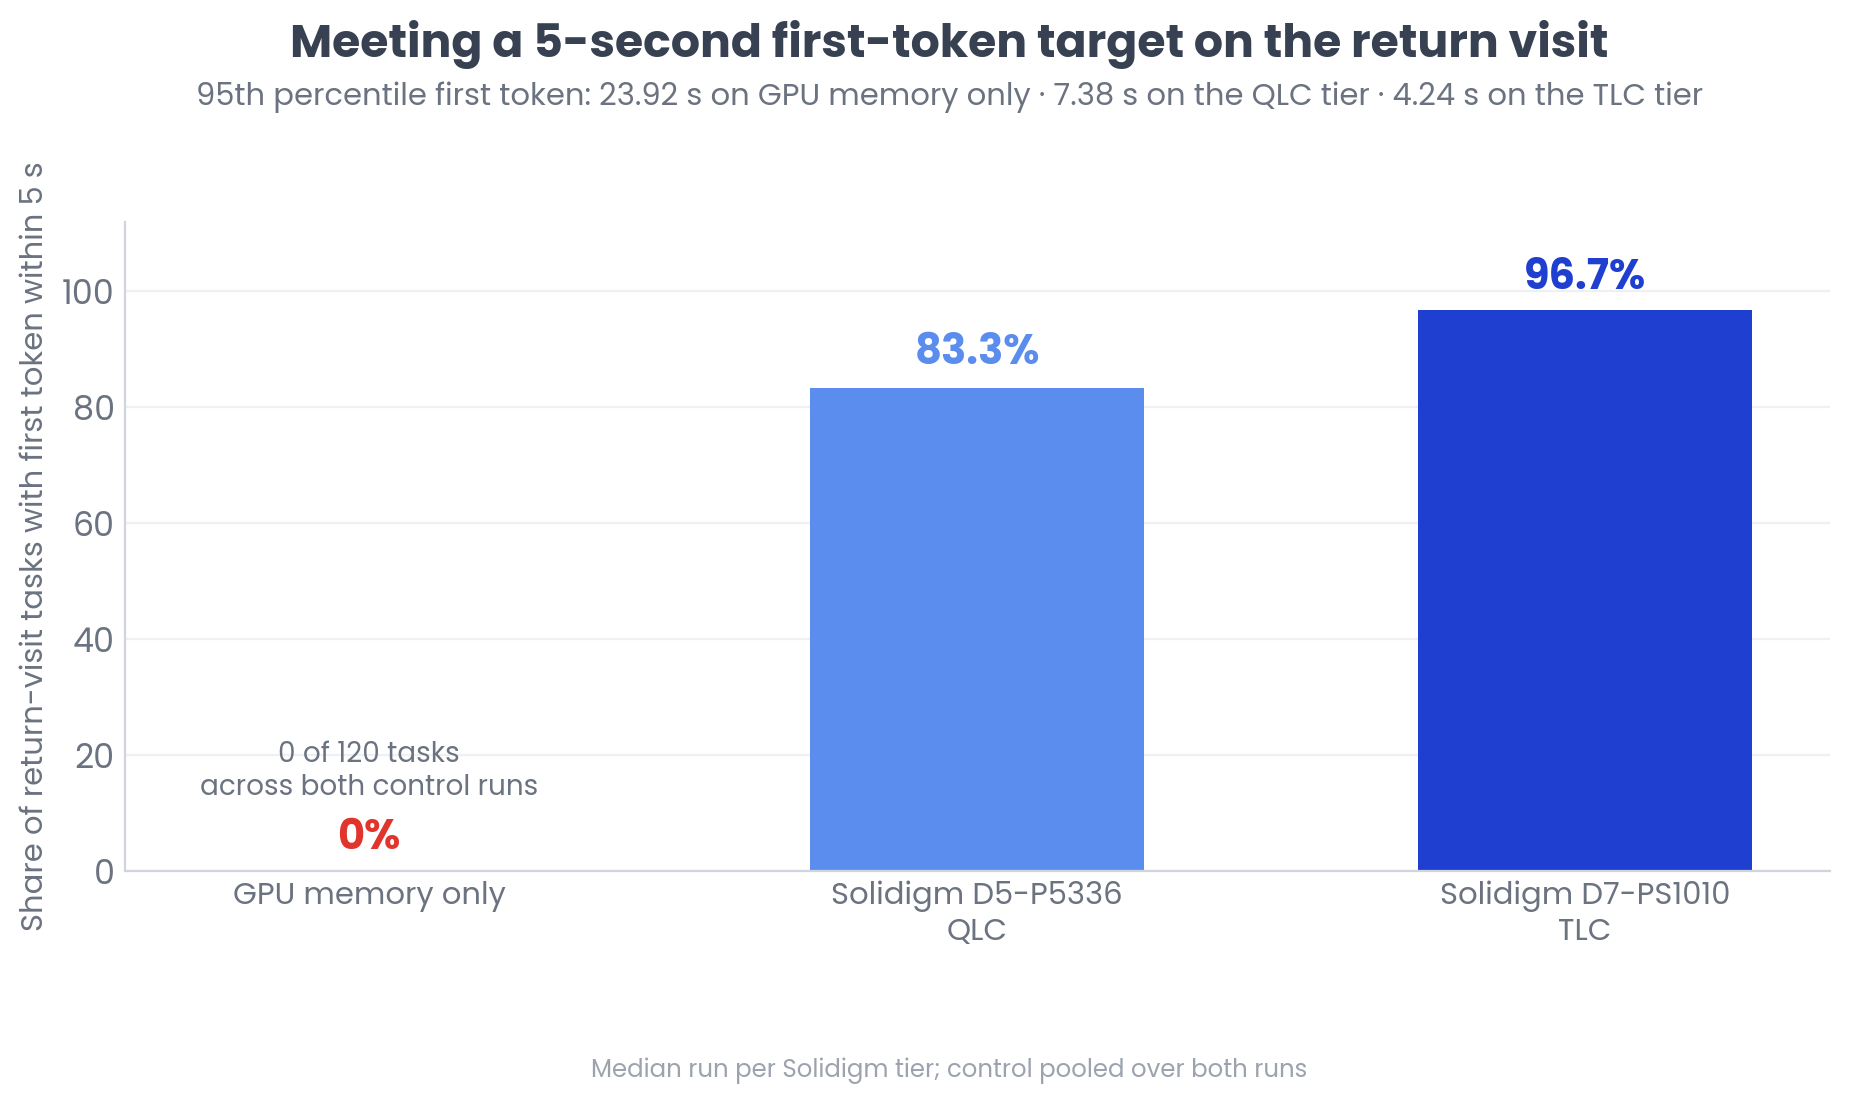
Figure 6 | Share of Return-Visit Tasks with a First Token Within Five Seconds
A five-second first token is a practical yardstick for an interactive agent. On the Solidigm D7-PS1010, 96.7% of return-visit tasks met it, and the 95th percentile landed at 4.24 seconds: the tail through the 95th percentile is inside the target, not just the median. Every D7-PS1010 task that returned a first token met the target; the misses are the requests that returned empty completions. The Solidigm D5-P5336 met it on 83.3% of tasks with a 95th percentile of 7.38 seconds. GPU memory only met it on none of the 120 tasks across both control runs, with a 95th percentile of 23.92 seconds (Figure 6).
Filling the Tier Has a Negligible Effect on the First Visit
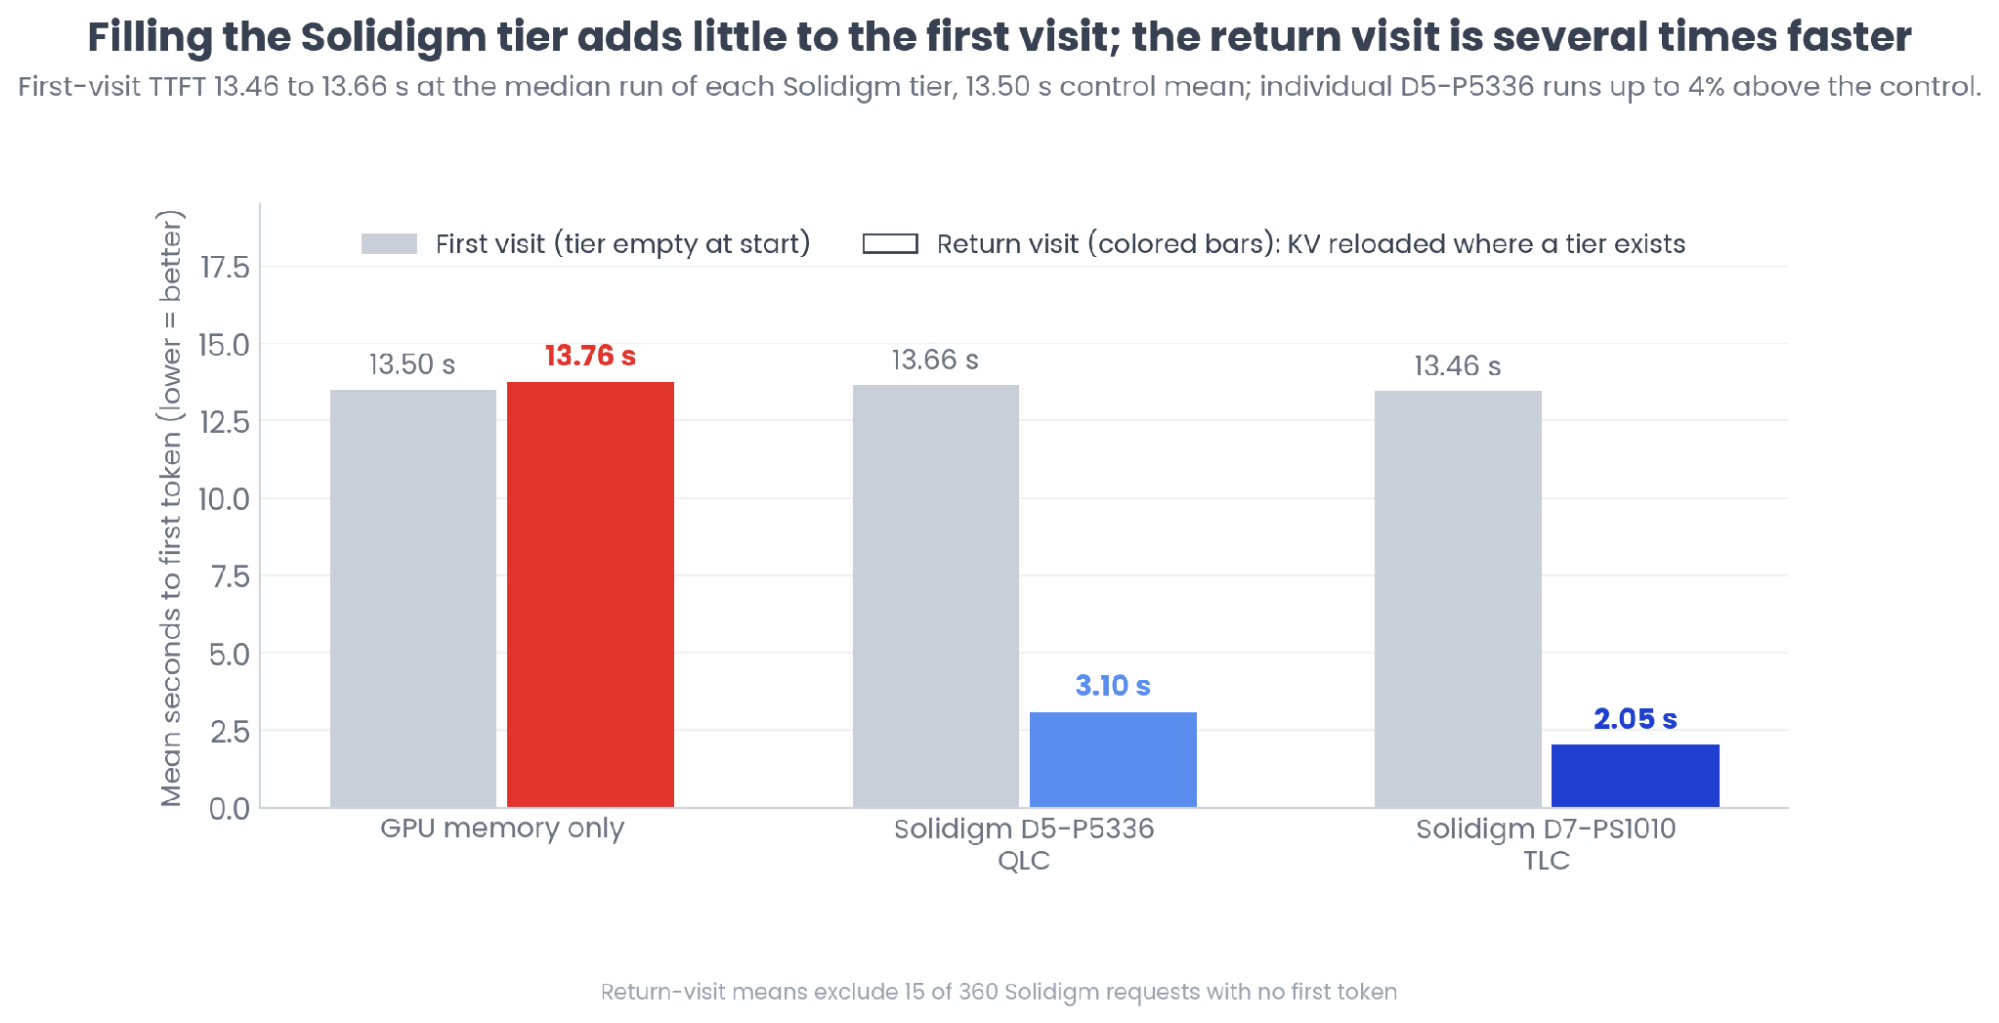
Figure 7 | First Visit vs Return Visit, Mean Time to First Token
Writing KV to the tier is not free in principle, so the first visit is where a penalty would show. First-visit time to first token was 13.50 seconds with GPU memory only, 13.46 seconds while writing KV to the D7-PS1010, and 13.66 seconds while writing it to the D5-P5336 (Figure 7). At the median run the D7-PS1010 came in slightly below GPU memory only and the D5-P5336 1.2% above it; individual D5-P5336 runs ranged from 13.60 to 14.04 seconds. Either way, the difference from GPU memory only is negligible next to the several-fold gain on the return visit.
The Performance Tier and the Capacity Tier
The Solidigm D5-P5336 cut return-visit time to first token from 13.76 seconds to 3.10, within about a second of the Solidigm D7-PS1010 (2.05 seconds), from a drive with eight times the capacity. The tail is what separates them: the D5-P5336's 95th percentile of 7.38 seconds sits outside a five-second target, where the D7-PS1010's 4.24 seconds sits inside.
The shape of that trade (Table 6) is the useful finding for infrastructure planners. The capacity tier gives up about a second on the mean and three on the tail, and keeps the same hit rate. For a deployment sized by how many sessions stay resident rather than by how fast the slowest one returns, 122.88 TB on one drive delivers eight times the drive capacity of the tested D7-PS1010 for about one second more time to first token. The two drives also differ in PCIe generation, capacity point and filesystem layout (whole drive versus one partition), so the gap is not attributable to NAND type alone. The D5-P5336 under test also hosted the node's Docker data root and metrics database, which the D7-PS1010 did not. Read rates are 30-second averages, so reload bursts are averaged out, and read latency, queue depth and I/O size were not recorded; this benchmark does not isolate the cause of the gap.
| Attribute | Solidigm D5-P5336 | Solidigm D7-PS1010 |
|---|---|---|
| NAND | QLC | TLC |
| Interface | PCIe 4.0 NVMe | PCIe 5.0 NVMe |
| SKU tested | 122.88 TB U.2 (SBFPF2BV0P12) | 15.36 TB U.2 15 mm (SB5PH27X153T) |
| Contexts per drive, estimate at 9 GB each | over 13,500 | over 1,700 |
| Return-visit time to first token, mean | 3.10 s | 2.05 s |
| Tasks within 5 s, return visit (median run) | 83.3% | 96.7% |
| LMCache hit rate, return visit | 99.84% | 99.83% |
| Peak read observed | 5.84 GB/s | 6.45 GB/s |
| Role | Capacity tier: the day's sessions, batch and CI agents | Performance tier: hot sessions, interactive agents |
Table 6 | Choosing the Tier (peak reads are 30-second averages, maximum over three runs; capacity estimates assume a full, managed tier, see The Hidden Tax on Agentic Inference)
What This Means for Your Infrastructure
Stop Recomputing What the Node Already Computed
A returning agent should not rebuild what another GPU in the same node already computed. On this workload the first token takes about 13.5 to 13.8 seconds when the context is recomputed. With the Solidigm tier, the first token arrived in about two seconds on the D7-PS1010 and about three on the D5-P5336. Each reload replaces a prefill the GPU has already done once.
Serve Every Replica, Not One Process
With one shared tier, the gateway balances load without knowing where any prefix lives, and all four replicas served hits at a 99.8% aggregate hit rate. A per-process cache cannot do this, because one replica cannot see KV another has written. Cache-aware routing can sit alongside the shared tier but is not required by it.
Scale KV Cache Capacity Without Scaling GPUs
Sixty tasks wrote 498 GB of KV, more than the node's GPU memory and more than this node's 384 GB of host DRAM, and at 9 GB per context each GPU could hold about six of the sixty contexts. Extending context capacity through Solidigm NVMe storage rather than through additional accelerators is the difference between a cache sized by what fits in GPU memory and one sized by what the workload needs.
Choose the Right Media Tier for Your Workload
The Solidigm D7-PS1010 (TLC) delivers the lowest response time, including at the tail, for latency-sensitive interactive agents. The Solidigm D5-P5336 (QLC) delivers eight times the drive capacity for about one second more on the mean, for capacity-sensitive environments where retained sessions matter more than the last second of latency. Both drives fit in the same node, as they did in this benchmark, so a deployment can pair a TLC tier for hot sessions with a QLC tier for long-lived ones.
Scope of This Benchmark
These results characterize one node, one model and one workload.
Scope of the measurement. Eight runs on a single four-GPU node, one model, sixty prompts of 62,000 to 152,000 tokens, and a fixed concurrency of four. The return visit replays each prompt unchanged, which is the best case for prefix reuse and, because the sixty prompts cycle through 498 GB between visits, the long-distance case for tier placement; reuse that returns within seconds is served from GPU memory in any configuration and is not measured here.
Host-memory layers. The Solidigm configurations run LMCache's 64 GiB CPU buffer on each replica, and the fs:// backend reads through the Linux page cache (O_DIRECT off). Device read counters recorded in a repeat run of each tier under the same configuration show the drive served at least as many bytes as were written (530 GB and 518 GB against 498 GB), so these layers contributed little; per-hit attribution was not recorded.
Write volume. LMCache writes every completed chunk to the tier, with no admission filter. Here all of the written KV was reused by design; in live use one-shot contexts are written too, so bytes written per byte reused will be higher. The first visit took about 295 seconds in the median run and wrote 498 GB, an average of about 1.7 GB/s with peaks near 2 GB/s (Table 5). Sustained around the clock, that rate would be about 9.5 drive writes per day on a 15.36 TB D7-PS1010 and about 1.2 on a 122.88 TB D5-P5336. A real node does not run cold first visits continuously, so this is a peak rate, not a duty cycle.
The Bottom Line
Coding agents should not pay twice for the same repository.
Across eight runs on a four-GPU agentic inference node, one shared Solidigm NVMe tier held 498 GB of KV cache, more than the node's GPU memory, and LMCache reported a 99.8% aggregate hit rate with hits on every replica. Against GPU memory alone, the return visit's first token came back 6.7x faster on the Solidigm D7-PS1010 and 4.4x faster on the Solidigm D5-P5336, and met a five-second target on 96.7% and 83.3% of tasks against none. First-visit time to first token was within 1.2% of GPU memory only at the median run.
The two drives divide the work. The Solidigm D7-PS1010 is the performance tier for interactive agents that need the first token inside five seconds. The Solidigm D5-P5336 is the capacity tier, estimated to hold over 13,500 contexts of this workload on a single 122.88 TB drive while keeping first-token latency near three seconds.
For infrastructure teams planning their next inference expansion, the question is not only how many GPUs to add. It is how much of the GPU capacity already installed is spent rebuilding the attention state it has already computed. A shared NVMe KV tier, measured here on Solidigm drives, turns that rebuild into a reload.
References
| 1. | W. Kwon et al., "Efficient Memory Management for Large Language Model Serving with PagedAttention," Proc. 29th ACM Symposium on Operating Systems Principles (SOSP '23), Oct. 2023. https://dl.acm.org/doi/10.1145/3600006.3613165 |
| 2. | NVIDIA, "RTX PRO 6000 Blackwell Server Edition." https://www.nvidia.com/en-us/data-center/rtx-pro-6000-blackwell-server-edition/ |
| 3. | Y. Liu, Y. Cheng, J. Yao, Y. An, X. Chen, S. Feng, Y. Huang, S. Shen, R. Zhang, K. Du and J. Jiang, "LMCache: An Efficient KV Cache Layer for Enterprise-Scale LLM Inference," arXiv:2510.09665, Oct. 2025 (v2 Dec. 2025). https://arxiv.org/abs/2510.09665 |
| 4. | Solidigm, "D7-PS1010 PCIe 5.0 NVMe SSD for Data Centers." https://www.solidigm.com/products/data-center/d7/ps1010.html |
| 5. | Solidigm, "D5-P5336 High-Density PCIe 4.0 SSD for AI," product page and product brief. https://www.solidigm.com/products/data-center/d5/p5336.html |
| 6. | Qwen Team, "Qwen3-Coder-30B-A3B-Instruct-FP8," Hugging Face, 2025. https://huggingface.co/Qwen/Qwen3-Coder-30B-A3B-Instruct-FP8 |
Copyright © 2026 Metrum AI, Inc. All Rights Reserved. This project was commissioned by Solidigm. Solidigm is a trademark of SK hynix NAND Product Solutions Corp. (d/b/a Solidigm) in the United States and other countries. NVIDIA, RTX PRO and Blackwell are trademarks of NVIDIA Corporation. AMD and EPYC are trademarks of Advanced Micro Devices, Inc. NVMe is a registered trademark of NVM Express, Inc. PCIe is a registered trademark of PCI-SIG. Qwen is a trademark of Alibaba Group. All other product names mentioned are the trademarks of their respective owners. Third-party names and logos identify the technology tested and do not imply endorsement by their owners.
DISCLAIMER: Performance results are based on the eight-run benchmark described in this paper, executed through the demo dashboard, and may vary by hardware and software configuration, including testing conditions, system settings, context length, output budget, concurrency level, cache settings, software versions, libraries used and other factors. All runs used a single model at a fixed concurrency of four with identical-prompt replay; results characterize the tested stack and should not be interpreted as guarantees of performance on different systems or workloads. Capacity figures are estimates derived from measured results as described in the text; they are not measurements. On the return visit, 15 of 360 requests on the Solidigm configurations returned an empty completion and are excluded from time-to-first-token statistics. The KV path ran through host memory using LMCache's filesystem backend with buffered I/O; no GPU-direct storage path was used. Testing used a single node with one workload and did not vary drive fullness, preconditioning, or concurrent read and write traffic. GB and TB are decimal units (1 GB = 10^9 bytes); GiB is binary (1 GiB = 2^30 bytes).