Measuring concurrent coding agent capacity across nine agentic tasks on the Dell PowerEdge™ R770 rack server with Intel® Xeon® 6 6760P processors and NVIDIA RTX™ PRO 6000 Blackwell Server Edition GPUs
Executive Summary
Enterprise AI is moving from single-turn assistants to fleets of autonomous coding agents. Each agent runs inside its own isolated sandbox, asks a model what to do next, then executes it: editing files, running builds, executing tests and calling shell tools. Most of that second kind of work lands on the host rather than on the accelerator, so capacity is set by the whole platform and by the task, not by an agents-per-GPU rule of thumb. Sizing an agent service therefore requires three measured answers: how many concurrent agents a server sustains within an agreed service level, which tier sets that ceiling, and the density below which the platform stops being economic to run.
This paper reports that measurement. On a single Dell PowerEdge R770 with two Intel Xeon 6 6760P processors and two NVIDIA RTX PRO 6000 Blackwell GPUs, the Agent Density benchmark grew fleets of identical coding agents one rung at a time, from 1 agent to 1,024, serving Ornith-1.5-35B-A3B-FP8 through vLLM and grading every attempt with the task's own verifier. All nine tasks qualified. The largest fleet each task held within its service level ranged from 120 concurrent agents on the compile-heavy kernel build to more than 1,024 on three tasks that never reached a limit. That more than eightfold spread on one chassis is the result that matters for planning: a single agents-per-server figure will overprovision an inference-dominated fleet by close to an order of magnitude, or underprovision a compile-heavy fleet badly enough to miss the service level in the first week of production. The figures in this paper let a platform team read chassis count, rack power and the next infrastructure investment from measured evidence rather than estimation.
Key Results at a Glance
Why Agent Density Needs a Service Level
Organizations deploying coding agents need one number to plan with: how many concurrent agents a server supports while the work still gets done on time. Existing guidance usually answers a nearby question instead, because the two most common approaches measure characteristics associated with capacity rather than capacity itself.
- A universal agents-per-GPU figure. Any figure quoted independently of the task and the service level overlooks the work an agent performs between inference calls. Sandbox startup, compilation, test execution and file operations all consume host resources. In this campaign the same two GPUs supported 120 agents on one task and more than 1,024 on another. No agents-per-GPU figure carries a spread of more than eightfold.
- A CPU-to-GPU time ratio. The ratio of sandbox core-seconds to GPU-busy seconds is a useful work profile, and this paper publishes it for all nine tasks. It predicts which tier will bind before a ladder is run. On its own it does not establish capacity, because it describes the shape of the work rather than a scaling limit.
Nothing breaks, so the promise decides where to stop
No gate threshold was crossed by a hardware or platform fault as agents were added. On the reference task, verified output kept rising through every rung to 1,024 agents while attempt latency climbed smoothly alongside it, and no subsystem failed at any level. A curve with no knee has no natural stopping point, so any single number read off it is arbitrary. The machine does not decide when to stop. Only a service-level target does.
This campaign therefore sets one explicit target per task and holds it constant across every rung of the ladder. The 95th-percentile agent attempt time must stay within the task's own deadline: 900 seconds for most tasks, 600 seconds for modernize-scientific-stack, 1,800 seconds for the kernel build and 3,600 seconds for portfolio-optimization. A second gate requires at least 75% of graded attempts to pass the task's verifier. A density that keeps both promises is a density a team can deploy at. A density that breaks either one is not, however many agents were technically alive.
Solution Architecture
The benchmark runs a single coding task across a fleet of agents, each in an isolated sandbox, and grades every attempt with the task's own verifier. Agent density is the only experimental variable within a run, and all components, including agents, sandboxes, model replicas, the router and telemetry, run on one chassis.
Pipeline stages
- Provisioning. The harness creates one Docker sandbox per agent, so a level of N agents starts N sandboxes at once, and releases the whole fleet as one wave.
- Quotas are caps, not reservations. The fleet shares all 256 logical CPUs, so the 8-CPU kernel build oversubscribes them above 32 agents.
- Execution. Each agent runs an independent loop: assemble context, call the model, run a command inside its sandbox, observe the result, repeat, until it submits a result or reaches its step cap or task deadline.
- One attempt per slot. This is a closed single-pass fleet, so a level of N agents produces N graded attempts.
- Grading. The task's verifier grades each result inside the same container, with held-out tests copied in only at grading time.
- Judgment. Per-agent spans, cgroup counters, host and GPU telemetry, vLLM state and chassis power align on one clock at a two-second cadence, and the harness judges each level against all seven gates before the ladder advances. When a rung fails, a binary search runs between the last rung that held and the first that failed.
This campaign disabled confirmation re-runs, so each published boundary is a single-observation claim, and confidence comes from comparing independent runs of the same task on the same host.
Configuration under test
The operator selects the task and the ladder. Every other parameter stays fixed for the duration of a run, so each level is evaluated under identical conditions.
| Dimension | Setting | Notes |
|---|---|---|
| Density ladder | Fixed per run | Core rungs of 1, 2, 12, 32, 64, 115, 128, 256, 512 and 1,024 agents, separated by at least 1.25x. The 8-CPU kernel build walks 1, 2, 4, 8, 14, 16, 32, 64 and 128.When a core rung fails, a binary search is automatically executed between the last passing rung and the failing rung to find the exact boundary. |
| Observation window | Derived | Single-pass fleet. Level window to the last verdict of any attempt; goodput window to the last passing verdict (see Terms). Not an operator setting. |
| Task | Fixed per run | Nine qualified Terminal-Bench tasks spanning inference-dominated, mixed and compute-heavy work profiles. One task per run, fixed across all levels. |
| Model and serving | Fixed | Ornith-1.5-35B-A3B-FP8 on two single-GPU vLLM replicas, tensor-parallel 1, behind one shared router. 256 concurrent sequences per replica, 512 in flight across both GPUs. |
| Per-agent quota | Fixed per task | 1 CPU and 2,048 MB for seven tasks, 1 CPU and 4,096 MB for portfolio-optimization, 8 CPUs and 8,192 MB for build-linux-kernel-qemu. Caps, not reservations. |
| Sandbox policy | Fixed | One Docker sandbox per agent. Task content baked into the image. Direct external egress blocked and routed through a proxy. |
| Service-level policy | Fixed per run | Agent attempt p95 within the task's own deadline, plus a verifier pass floor of 75%. Goodput and energy ceilings were not configured. |
| Gate set | Fixed | Version 10. Seven gates covering the service level and the integrity of the measurement itself. See Table 2. |
Table 1 | Configuration under test for the agent density ladder.
Qualification gates
A level qualifies only when all seven gates hold. The first two are the service level. The remaining five confirm that the measurement itself was sound, which matters because a container failure or a telemetry gap can otherwise be mistaken for capacity.
| Gate | Threshold |
|---|---|
| Latency ceiling | Agent attempt p95 within the task deadline. Guards against publishing a density at which agents no longer finish on time. |
| Task pass floor | At least 75% of graded attempts pass, significance-tested. Guards against buying latency with wrong answers. |
| Agent deadline rate | No more than 10% of attempts stopped by the deadline |
| Infrastructure success | At least 95% of sandboxes start and are accounted for |
| Resource faults | No OOM kills above 5%, no GPU XID or ECC errors |
| Memory pressure | Host memory-stall time no more than 10%, attributed to the fleet |
| Measurement integrity | Telemetry coverage at least 95%, stable GPU identity, no counter resets |
Table 2 | Qualification gates, gate set version 10.
Serving queue depth, goodput regression and scaling efficiency are recorded as observations and never end a sweep. One further stop condition sits outside the gate set: a vLLM preemption count above zero marks a level unstable and ends a sweep. Portfolio-optimization is the one published task where this trigger, rather than the service level, set the figure.
Reference architecture
All components run on a single Dell PowerEdge R770 chassis.
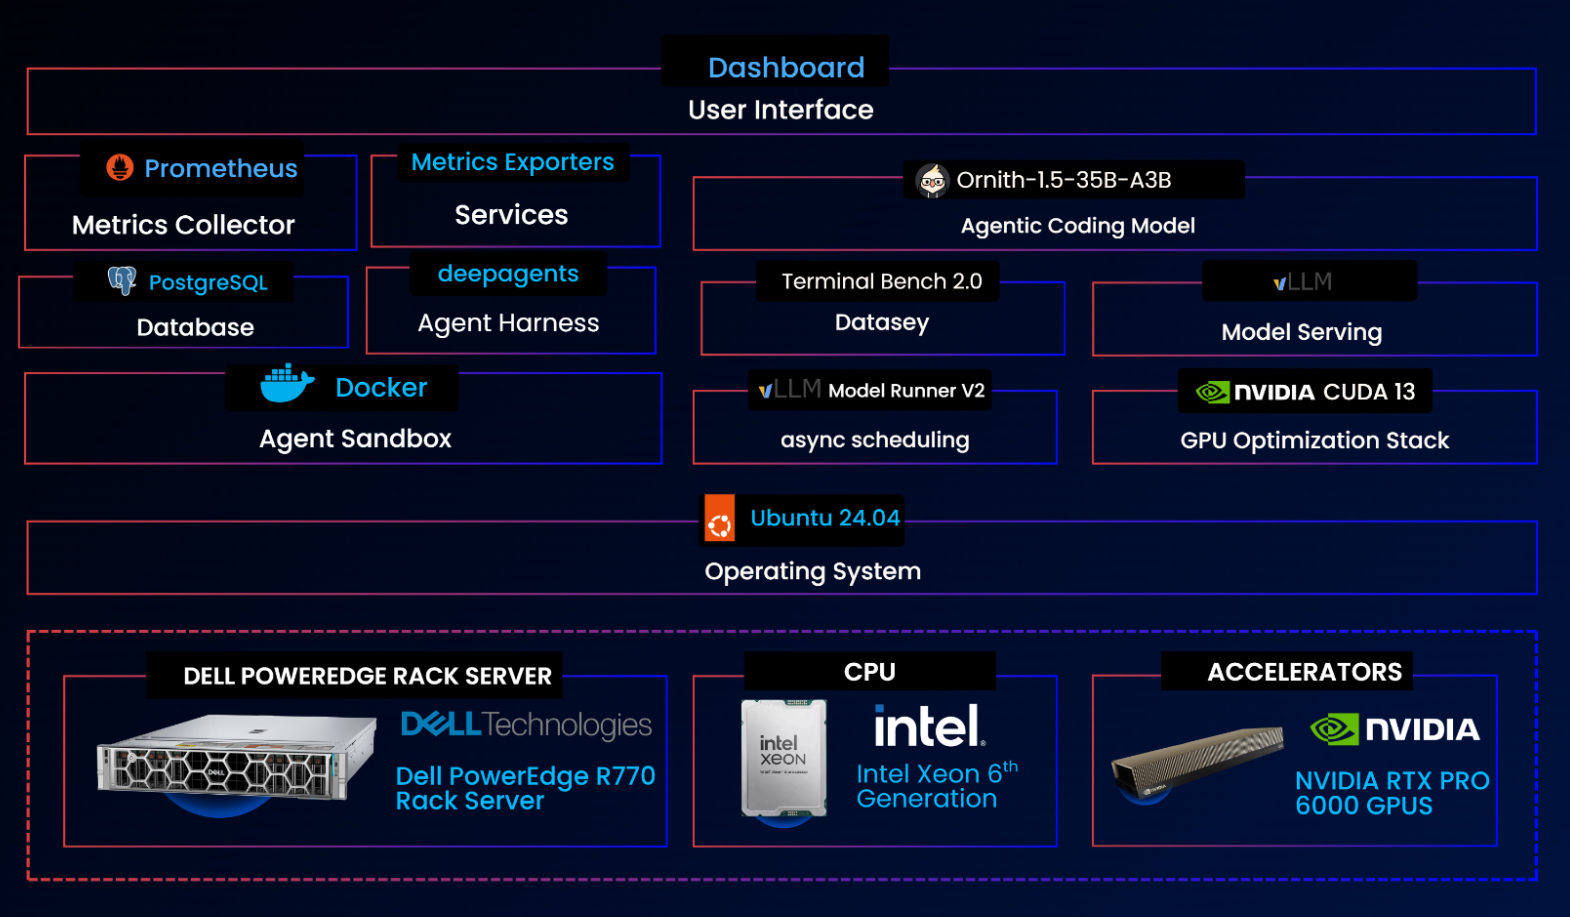
Figure 1 | Technical architecture of the agent density workload.
Performance Benchmark
The nine runs behind this paper each walked the density ladder from a single agent to the top rung, grading every attempt with the task's own verifier. The nine tasks are drawn from Terminal-Bench, a public benchmark of hand-written, human-verified terminal tasks that each ship with an objective verifier: eight are unmodified Terminal-Bench 2.0 tasks, and the kernel build, build-linux-kernel-qemu, is taken from the Terminal-Bench 1.0 core registry with its CPU declaration set to 8.
Capacity across nine tasks
Nine tasks qualified on the same chassis under each task's own latency target. Three held every rung to the top of the ladder and are published as lower bounds, because the machine was never pushed to a limit on them. Two were bracketed by a failing level directly above and are published as verified. The rest sit between, bounded either by a failing rung or by the end of the ladder.
| Task | Work profile | Fleet size within service level | Confidence | Pass rate | Agent p95 against deadline |
|---|---|---|---|---|---|
| git-leak-recovery | Inference-dominated | 1,024 or more | High | 99% | 602 s of 900 s |
| log-summary-date-ranges | Inference-dominated | 1,024 or more | High | 98% | 380 s of 900 s |
| modernize- scientific-stack | Mixed | 1,024 or more | High | 98% | 507 s of 600 s |
| fix-git | Mixed | 902, verified | High | 87% | 891 s of 900 s |
| portfolio- optimization | Compute-heavy | 656 | Medium | 99% | 2,696 s of 3,600 s |
| multi-source-data-merger | Mixed | 644, verified | High | 93% | 861 s of 900 s |
| kv-store-grpc | Mixed | 434 | Medium | 85% | 437 s of 900 s |
| openssl- selfsigned-cert | Inference-dominated | 242 | Medium | 98% | 276 s of 900 s |
| build-linux-kernel-qemu | Compute-heavy | 120 | High | 86% | 1,639 s of 1,800 s |
Table 3 | Published agent density per task. A figure of 1,024 or more means every rung of the ladder held and no limit was found. Every other figure is the highest level at which all seven gates held; for openssl-selfsigned-cert and kv-store-grpc the next rung breached a measurement-integrity gate rather than the service level.
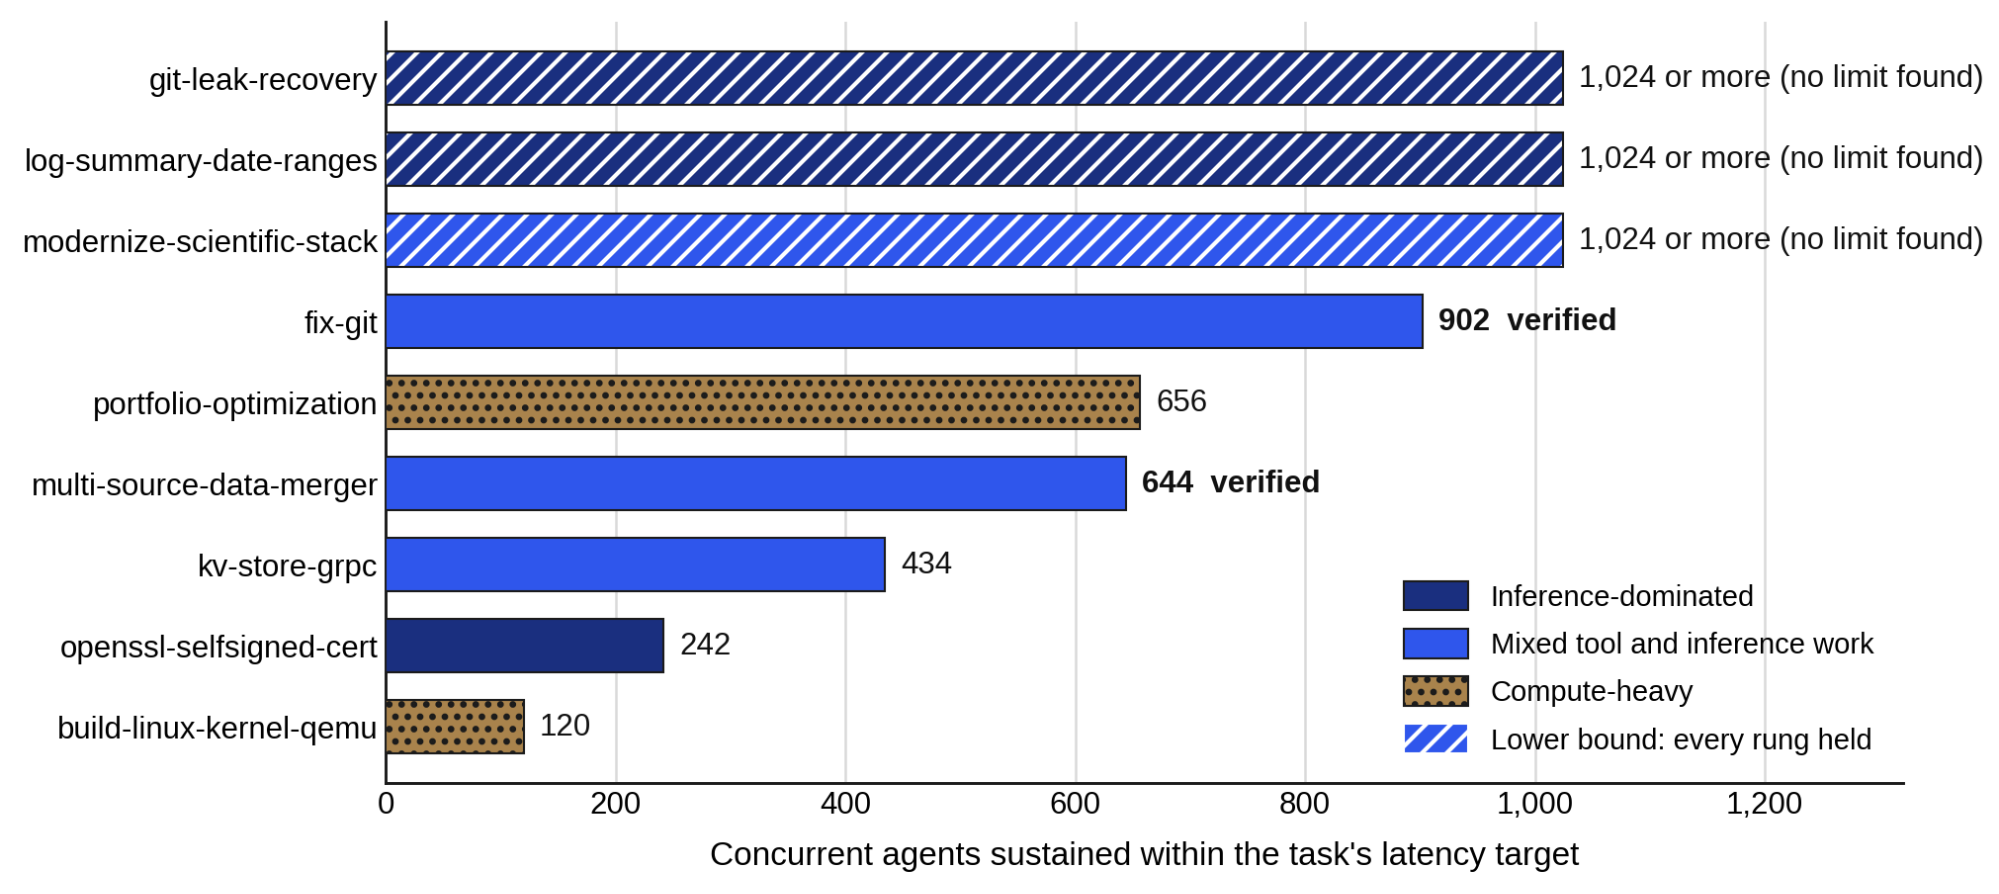
Figure 2 | Fleet size within service level for each task on one Dell PowerEdge R770. Hatched bars are lower bounds: the ladder ended at 1,024 agents with no limit found, so their true capacity is higher than shown.
Where the ceiling sits
On inference-dominated and mixed work, two mechanisms combine at the boundary. The first is GPU compute: the mixture-of-experts model is decode-bound at these batch sizes and both accelerators are simply full. The second is a serving-configuration ceiling. Each vLLM replica admits 256 concurrent sequences, 512 across the two GPUs, and telemetry shows running requests pinned at exactly 512 on every level above 512 agents. A fleet larger than 512 can still be served, because agents spend much of their time in the shell and the verifier rather than inferring, but past that point every extra agent adds queueing.
Time to first token tells the same story in one number. It sits between 0.2 and 0.5 seconds at every rung up to 512 agents, then jumps to tens of seconds at the published densities above 512 agents, 16.6 seconds on fix-git at 902. The agents are waiting on the model, and the two Intel Xeon 6 6760P processors still had room at every published level: 902 concurrent sandboxes ran at an 8% mean host CPU, sandbox start-up p95 never exceeded 2.6 seconds, and host memory peaked at no more than 435 GB of the 1,056 GB reported. Two readings need their context: modernize-scientific-stack reached its published density with its GPUs only 53% busy and 37% of requests queued, so the admission limit rather than GPU compute set its pace, and fix-git's 96% host-CPU peak is brief bursts of hundreds of sandboxes running git at once against a mean of 8%.
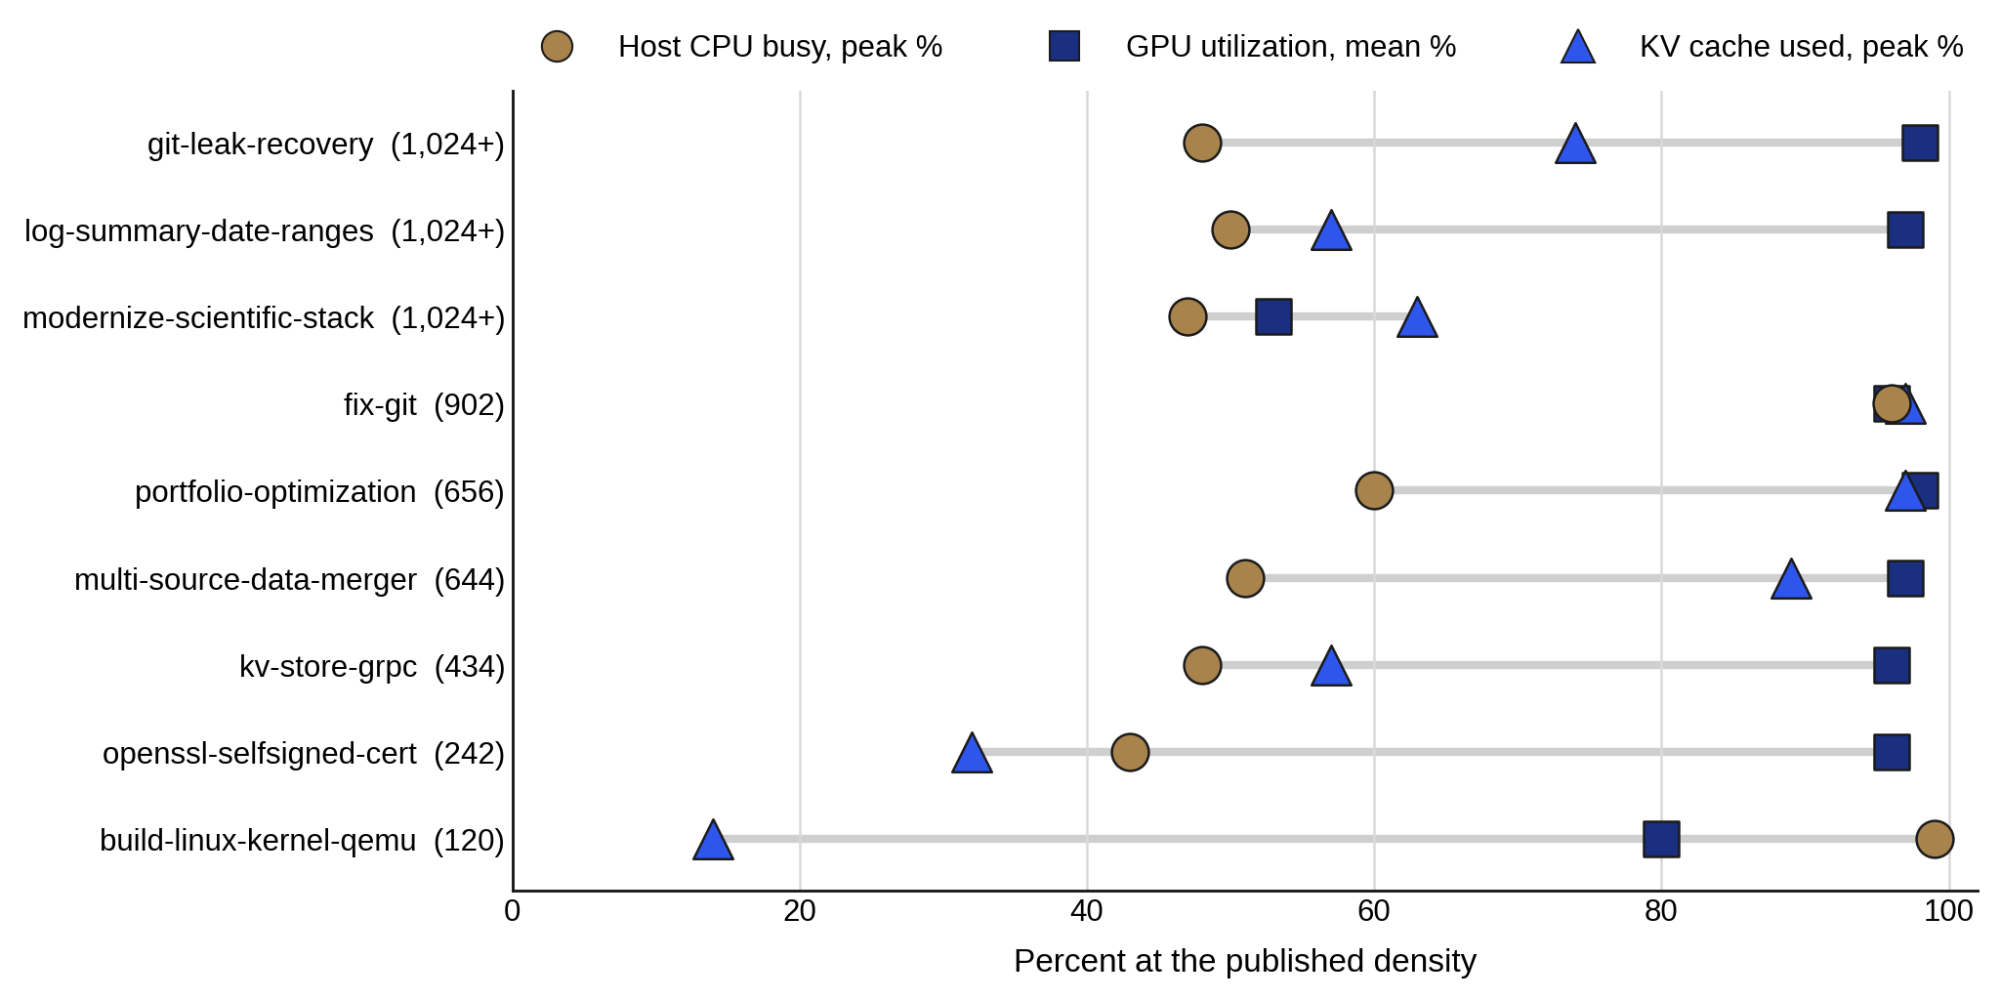
Figure 3 | Host CPU, GPU and KV-cache readings at each task's published density.
Two work profiles, two different walls
For every level the benchmark records how many CPU core-seconds the sandboxes consumed for each GPU-busy second the model replicas consumed. That ratio separates the nine tasks cleanly and predicts which tier will bind before a ladder is run. openssl-selfsigned-cert (0.36 : 1) and git-leak-recovery (0.45 : 1) are almost pure inference. fix-git (4.69 : 1) mixes real tool work with inference. build-linux-kernel-qemu (82 : 1) compiles and boots a Linux kernel: for every second the accelerator spends thinking, that fleet spends 82 core-seconds building, and it is the one task where the host rather than the serving tier sets the limit.
| Task | Core-seconds per GPU-busy second | Host CPU peak | GPU busy, mean | Binding tier at boundary |
|---|---|---|---|---|
| openssl-selfsigned-cert | 0.36 : 1 | 43% | 96% | Serving tier |
| git-leak-recovery | 0.45 : 1 | 48% | 98% | Serving tier |
| log-summary-date-ranges | 0.78 : 1 | 50% | 97% | Serving tier |
| kv-store-grpc | 1.22 : 1 | 48% | 96% | Serving tier |
| multi-source-data-merger | 1.56 : 1 | 51% | 97% | Serving tier |
| fix-git | 4.69 : 1 | 96% | 96% | Serving tier |
| modernize-scientific-stack | 6.40 : 1 | 47% | 53% | Serving slot limit |
| portfolio-optimization | 15.05 : 1 | 60% | 98% | Serving tier, preemption |
| build-linux-kernel-qemu | 82.19 : 1 | 99% | 80% | Host CPU |
Table 4 | Work profile and binding tier at each task's published density. Core-seconds are summed over every sandbox in the level, and GPU-busy seconds over both accelerators.
The fix-git ladder in detail
fix-git is the reference task. The agent must recover commits that went missing after a checkout and merge them into master, at 1 CPU and 2,048 MB against a 900-second deadline. Attempt latency grows slowly to 512 agents and then steeply, and the knee coincides exactly with the point where the serving tier fills.
| Agents | Result | Pass rate | p95 (s) | Tasks / min | TTFT (s) | GPU busy, mean | KV cache |
|---|---|---|---|---|---|---|---|
| 1 | Held | 100% | 20 | 2.8 | 0.2 | 34% | 1% |
| 12 | Held | 75% | 60 | 8.1 | 0.2 | 77% | 2% |
| 32 | Held | 91% | 69 | 21.9 | 0.2 | 83% | 6% |
| 128 | Held | 87% | 169 | 38.5 | 0.2 | 89% | 20% |
| 256 † | Held | 89% | 264 | 32.5 | 0.3 | 78% | 39% |
| 512 † | Held | 91% | 451 | 33.2 | 0.5 | 80% | 77% |
| 902 | Held | 87% | 891 | 51.6 | 16.6 | 96% | 97% |
| 943 | Failed SLA | 88% | 916 | 54.5 | 18.7 | 96% | 98% |
| 1,024 | Failed SLA | 85% | 989 | 56.7 | 24.2 | 96% | 98% |
Table 5 | fix-git density ladder in ladder order. The 943 and 1,024 levels breached the 900-second ceiling, so 902 is the verified boundary.
The 902 and 943 rungs come from the binary search triggered when the core 1,024 rung failed; rungs at 2, 64 and 115 agents appear in the companion report. Host CPU peak sat between 44% and 56% from 32 to 512 agents and reached 96% at 902, where the mean was 8%. Model output rose 22.5 times across the ladder, from 140 to 3,156 tokens per second. Daggered levels are straggler-distorted: one or two slow attempts stretched the goodput window, understating tasks per minute and mean GPU utilization at 256 and 512 agents while latency and pass rates are unaffected. No boundary level was distorted.
Task quality holds under load
Across the nine published densities the verifier pass rate is 85% to 99%. At every rung from 12 agents up to each boundary it stays inside the band the task shows at low density: 75% to 92% on fix-git, 75% to 92% on kv-store-grpc, and 86% to 100% on the other seven. Density moved latency and per-agent token rate. It did not move correctness.
One case is instructive rather than contradictory. On multi-source-data-merger at 1,024 agents, well above its 644-agent boundary, 664 of 1,024 agents hit the deadline and the pass rate fell to 33%. That is what deep oversubscription looks like on a single-pass fleet, and it is exactly the failure the latency gate exists to catch before publication. Pass rates describe how often this model solves these tasks, not how well the platform runs them.
Power and energy
Whole-node power comes from the PowerEdge R770 chassis ACPI power meter through hwmon, CPU package power from RAPL and GPU board power from DCGM, all sampled at two-second intervals on a common clock.
Node mean power stayed within 1.46 kW to 1.86 kW at the published densities, with instantaneous peaks to 2.3 kW, against about 1.0 kW at a single agent. That is a narrow envelope for a swing from 1 agent to 1,024, and it means the baseline dominates: most of the bill is present before the first agent starts work. Because the baseline is fixed, it amortizes as density rises. On fix-git, whole-node metered energy per passed task fell from 6.5 Wh at 1 agent to 0.60 Wh at 902, while verified output rose eighteenfold and model output 22.5-fold over the same range. Every task improved by roughly an order of magnitude between one agent and its boundary. The compile-heavy kernel build is the exception at 7.6 Wh per verified task, because compiling and booting a kernel is simply a lot of work per verified result.
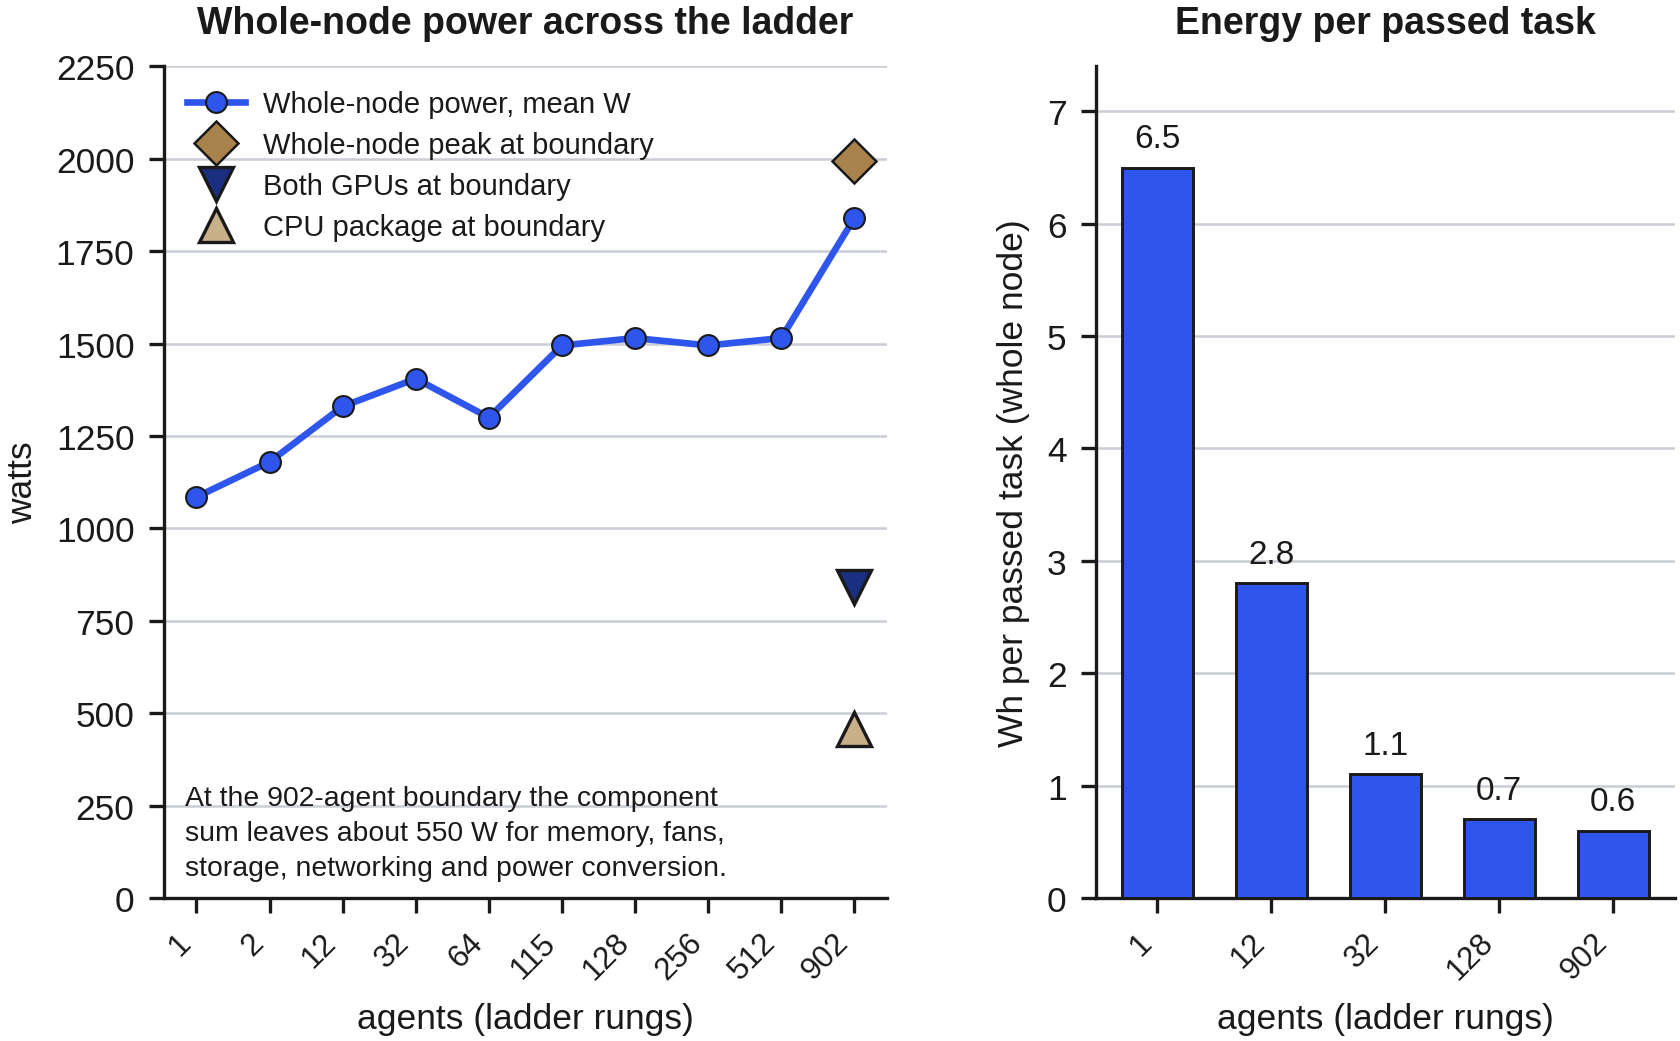
Figure 4 | fix-git: power across the ladder, and whole-node energy per passed task. Energy is shown for the rungs whose rate figures are undistorted, all of which appear in Table 5; the power series covers every rung.
This campaign configured a latency ceiling and a pass floor, but no goodput or energy ceilings, so the density floor here is economic rather than a gate result. An operator who sets an energy-per-task or throughput target will find that the density which fails it is the low one, and that is the opposite of the intuition that lower density is always safer. Running an agent fleet sparsely is the expensive mistake.
How to read these figures
- One host, one model, one serving layout. Every number is specific to Ornith-1.5-35B-A3B-FP8 on two single-GPU vLLM replicas with a 256-sequence admission limit each, so the method transfers but the constants do not.
- This is not the model vendor's reference serving recipe. The model card recommends tensor-parallel 2 and documents a 262,144-token context window, while this campaign ran one replica per accelerator at tensor-parallel 1 with context at 131,072 tokens, because two independent replicas behind a router serve a large agent fleet better than one tensor-parallel instance.
- The latency target is the task's own deadline. The deadline is checked between steps, so an attempt stopped by the deadline is recorded at the time its in-flight step returned and its recorded duration can exceed the deadline by one step. The p95 of a failing level can therefore exceed the deadline, as it does at 943 and 1,024 agents on fix-git. At every published level fewer than 5% of attempts were deadline-stopped, so the published p95 values, two of which sit within 1% of their ceiling, are the measured tail.
- Single-pass fleets measure throughput conservatively at mid-ladder rungs, and exclude fleet start-up. A level's window ends with its slowest agent, so tasks per minute at the flagged levels understates steady-state throughput while latency and pass rates are unaffected. Bringing 902 sandboxes up took 117 seconds at p95, so an operator planning cold starts should add the ramp.
- The three lower bounds are not a ceiling. git-leak-recovery, log-summary-date-ranges and modernize-scientific-stack held every rung including the top, so their figures should never be quoted as 1,024.
- Read each published figure as the center of a band. Densities on this host reproduced across independent runs to within roughly 15% of agent count, and a small change in how many agents finish can move p95 across a ceiling.
Business Impact
A validated agent-density measurement informs four infrastructure planning decisions directly: how many chassis a target fleet needs, how much rack power to allocate, where the next infrastructure dollar should go, and the density below which the platform is uneconomic to operate.
- Size fleets by task profile, not by GPU count. On this configuration the published fleet sizes on inference-dominated and mixed work ran from 242 to more than 1,024 agents per chassis under each task's own attempt target, with the reference task, fix-git, at 902 concurrent agents, while a compile-heavy fleet sizes at roughly 120 agents with an 8-CPU cap each. A team that knows its task mix can read chassis count from Table 3 and the energy-per-task curve from Figure 4, which replaces estimate-based sizing that on this evidence can overprovision by close to an order of magnitude.
- Invest in the tier that is actually binding. For inference-dominated fleets, raise the per-replica concurrency limit first, then add a third GPU and replica: at seven of the eight serving-bound boundaries host CPU peaked at or below 60% against means of 2% to 15%, host memory stayed below half of the 1,056 GB reported and sandbox admission p95 stayed under 2.6 seconds, so the two Intel Xeon 6 6760P processors carried the sandbox fleet with capacity to spare. Two tasks peaked above 90%: fix-git at 96%, a brief burst of hundreds of sandboxes running git against an 8% mean, and the compile-heavy kernel build at 99%, where the host is the binding tier. The attribution is inferred from utilization rather than from a harness bottleneck verdict, so confirming it would require intervening on the host quota and re-measuring. For compile-heavy fleets the reverse holds, and the kernel build's accelerators had roughly 20% headroom at 120 agents, so on that profile additional cores convert directly into additional agents.While mean CPU utilization remained low, tasks with high transient peaks (like fix-git) will eventually require host scaling to prevent burst-contention if serving limits are removed.
- Plan rack power from node-scope measurement. Plans built from CPU and GPU counters alone would place the chassis about 30% too low, because node draw is 1.4 times the component sum. Provision the rack from node-scope measurement and treat the fixed baseline as the dominant term at low utilization.
- Operate above the density floor. Every task's energy per verified result improved by roughly an order of magnitude between one agent and its boundary. The fixed platform baseline amortizes only when the machine is full, so a team that provisions generously and runs at low density pays it twice: once in capital and again in energy per completed task.
Conclusion
The question of how many coding agents a server can run has no single answer, and this campaign shows why in measured terms. On one Dell PowerEdge R770 with two Intel Xeon 6 6760P processors and two NVIDIA RTX PRO 6000 Blackwell GPUs, nine tasks produced nine defensible answers between 120 and more than 1,024 concurrent agents, each tied to a stated latency target and a verified pass rate. The reference figure is 902 concurrent fix-git agents within a fifteen-minute attempt-latency target, bracketed by a failing level at 943.
One methodological finding travels further than any capacity number. The machine does not say when to stop. Verified output kept rising above every published boundary and no subsystem failed, so only an explicit service level converts a smooth curve into a figure an operator can deploy against. What generalizes beyond that is the shape of the result. Inference-dominated agent work binds on the serving tier while the host retains capacity. Compile-heavy work binds on cores, where core count converts directly into agent density and the accelerators retain headroom. Task quality held at every published density, and energy per verified task fell by roughly an order of magnitude as the fleet grew. Both tiers are therefore sized from the measured work profile and the service level, not from accelerator count or a fixed CPU-to-GPU ratio. Those are the facts a platform team needs to size a fleet, choose the next investment and plan the rack, and this work measured them rather than inferring them..
Next Steps
Three steps convert this measurement into a plan for a specific estate.
- Profile the task mix before sizing anything. Core-seconds per GPU-busy second predicts whether the estate will bind on serving capacity or on cores, and it is cheaper to measure than a full ladder.
- Set the latency target first, then measure capacity against it. A density without a stated promise is not a planning number, and teams with a target tighter than fifteen minutes should read their own figure off the fix-git ladder in Table 5 rather than adopting the published boundary.
- Raise the serving ceiling before adding hardware. On this configuration the per-replica concurrency limit is the first adjustment and a third GPU and replica the second. Both are cheaper than a second chassis, and the Intel Xeon 6 host tier was never the constraint at any serving-bound boundary.
For teams already standardized on Dell PowerEdge for AI infrastructure, raising agent density on this configuration is a serving-tier configuration change rather than a re-platforming exercise.
Appendix: System Under Test
CPU, core and thread counts, memory, kernel and GPU identity were read from the machine at run time and are embedded in every evidence bundle. Server model, DDR generation, storage and TDP are from the platform specification.
| Component | Specification |
|---|---|
| Server platform | Dell PowerEdge R770 rack server |
| CPU | 2 x Intel Xeon 6 6760P processors, 64 cores and 128 threads per socket, 330 W TDP. 128 physical cores, 256 logical CPUs |
| Memory | 1 TB DDR5, 1,056 GB reported |
| GPU | 2 x NVIDIA RTX PRO 6000 Blackwell Server Edition GPUs, 96 GB GDDR7 each |
| Storage for run data | 3.2 TB NVMe volume for run artifacts and sandbox layers |
| Operating system | Ubuntu 24.04 LTS, kernel 6.8.0-138-generic |
| Model | ornith-ai/Ornith-1.5-35B-A3B-FP8, revision 0e048080. A 35B-parameter mixture of experts with roughly 3B parameters active per token, FP8 weights |
| Model serving | vLLM v0.27.1, pinned by digest. Two replicas, one per GPU, tensor-parallel 1, behind one shared router. Context 131,072 tokens, GPU memory target 0.90, 256 concurrent sequences per replica |
| Agent framework and sandbox | deepagents on LangGraph, ReAct loop, one Docker sandbox per agent. Task content baked into the image, held-out tests copied in only at grading time. CPU quota and memory limit enforced per container, direct external egress blocked, and the verifier runs in the same container after the agent finishes |
Table 6 | System under test: hardware and software stack.
| Task | What the agent must do |
|---|---|
| git-leak-recovery | Recover a secret removed by a history rewrite and purge it without touching other commits. |
| log-summary-date-ranges | Aggregate severity counts from dated log files across several rolling date ranges. |
| modernize-scientific-stack | Port a legacy climate-analysis script to current numpy and pandas APIs and declare dependencies. |
| fix-git | Recover commits that went missing after a checkout and merge them into master. |
| portfolio-optimization | Re-implement a nested-loop portfolio risk model as a C extension, within 1e-10 of the Python baseline and at least 1.2x faster at 5,000+ assets. |
| multi-source-data-merger | Merge user records from JSON, CSV and Parquet sources, resolving conflicts. |
| kv-store-grpc | Define a key-value service in protobuf, generate gRPC stubs and run a conforming server. |
| openssl-selfsigned-cert | Generate a 2048-bit RSA key and self-signed TLS certificate with the required file permissions. |
| build-linux-kernel-qemu | Build Linux 6.8 from source, generate an initramfs and boot it under QEMU. |
Table 7 | The nine qualified tasks, from Terminal-Bench. Task content is pinned by hash and unchanged across the campaign.
Reproducibility
The campaign ran auto qualification in service-level limit mode on a closed single-pass fleet, with a minimum ladder step of 1.25x and a five-level boundary search budget. Confirmation runs were disabled, so each boundary was measured once. High confidence in Table 3 means the figure reproduced across independent runs with clean telemetry, and Medium means two or more runs agreed within roughly 15%, with any outlier identified. Latency is judged on agent work only, from release to agent finish, with fleet ramp and the verifier excluded. One reading rule applies to the kernel build: it changed its declared shape on 28 August 2026, from 16 to 8 CPUs per agent, so the 120 figure is comparable only with other post-change runs, both of which found the latency ceiling at 128. Run identifiers and per-run evidence bundles are listed in the companion report and available on request.
Terms used in this paper
Agent attempt p95 is the 95th-percentile time from an agent's release to the end of its own work, over every attempt in the level including those stopped by the deadline, excluding fleet start-up and the verifier; the latency service level is judged on it. Verified goodput is attempts that passed the task's verifier, per minute of the goodput window, which runs from fleet release to the last passing verdict. The level window, from fleet release to the last verdict of any attempt, bounds telemetry, power and GPU-busy accounting. A figure is verified when a failing level exists above the published one and the interval between them was searched, and a lower bound when the level above was not valid or the ladder ended.
References
| 1. | Agent Density on Dell PowerEdge R770. Benchmarking report, campaign 2026-08-29-agents, September 2026. Companion technical report to this paper, including per-task ladders and the full gate set. |
| 2. | Agent Density campaign manifest and per-run evidence bundles, runs of 26 August to 1 September 2026. Run identifiers listed in the companion report. Available on request. |
| 3. | Dell Technologies. PowerEdge R770 spec sheet. https://www.delltechnologies.com/asset/en-us/products/servers/technical-support/poweredge-r770-spec-sheet.pdf |
| 4. | Intel Corporation. Intel Xeon 6760P processor product specifications. 64 cores and 128 threads per socket, 330 W TDP. https://www.intel.com/content/www/us/en/products/sku/241836/intel-xeon-6760p-processor-320m-cache-2-20-ghz/specifications.html |
| 5. | NVIDIA Corporation. NVIDIA RTX PRO 6000 Blackwell Server Edition. 96 GB GDDR7 per GPU. https://www.nvidia.com/en-us/data-center/rtx-pro-6000-blackwell-server-edition/ |
| 6. | Ornith AI. ornith-ai/Ornith-1.5-35B-A3B-FP8 model card. Revision 0e048080 used in this campaign. https://huggingface.co/ornith-ai/Ornith-1.5-35B-A3B-FP8 |
| 7. | vLLM project. Release v0.27.1, published 11 August 2026. https://github.com/vllm-project/vllm/releases/tag/v0.27.1 |
| 8. | LangChain. deepagents, the agent harness used in this campaign. https://github.com/langchain-ai/deepagents |
| 9. | Terminal-Bench, a Stanford University and Laude Institute project. Task registry and dataset versions. https://www.tbench.ai/ |
Image sources: Figures 2 to 4 are generated from the evidence bundles listed in the companion report.
Copyright © 2026 Dell Inc. or its subsidiaries. All Rights Reserved. Testing was performed by a third party commissioned by Dell Technologies. Dell and other trademarks are trademarks of Dell Inc. or its subsidiaries. NVIDIA and RTX PRO are trademarks of NVIDIA Corporation. Intel and Xeon are trademarks of Intel Corporation.
DISCLAIMER: Performance varies by hardware and software configurations, including testing conditions, system settings, application complexity, the quantity of data, batch sizes, software versions, libraries used, and other factors. The results of performance testing provided are intended for informational purposes only and should not be considered as a guarantee of actual performance.