Three agentic workloads on the Dell PowerEdge™ R7725 with AMD Instinct™ MI350P, AMD EPYC™ 9555, and Terminal-Bench 2.0
September 2026 · Benchmark by Metrum AI on Dell PowerEdge R7725 with AMD Instinct MI350P accelerators
EXECUTIVE SUMMARY
AMD reports that 95% of enterprises it surveyed expect to be using agentic AI by 2027, and has raised its server CPU market forecast to more than 35% annual growth and over $120 billion by 2030 on the strength of that shift.[4] The mechanism it describes is a change in ratio: a chatbot-era deployment ran one CPU alongside four to eight GPUs, while agentic AI moves toward 1:1 and, in some cases, higher on the CPU side.[1] That forecast counts devices in a deployment. This study measures something narrower and more testable: busy time on one server, CPU core-seconds consumed against GPU busy-seconds delivered. Read the two together for direction, not as the same quantity.
The reason is what an agent actually does. Where a chatbot takes a prompt and returns tokens, an agent loops: write code, run it, read the error, decide what to try next. Only one step in that loop is the model thinking. Everything else lands on the CPU, pass after pass, until a grader passes the work. Run one agent and the accelerator simply waits; run a hundred and it stays busy serving the others, but the host is now carrying a hundred loops at once.
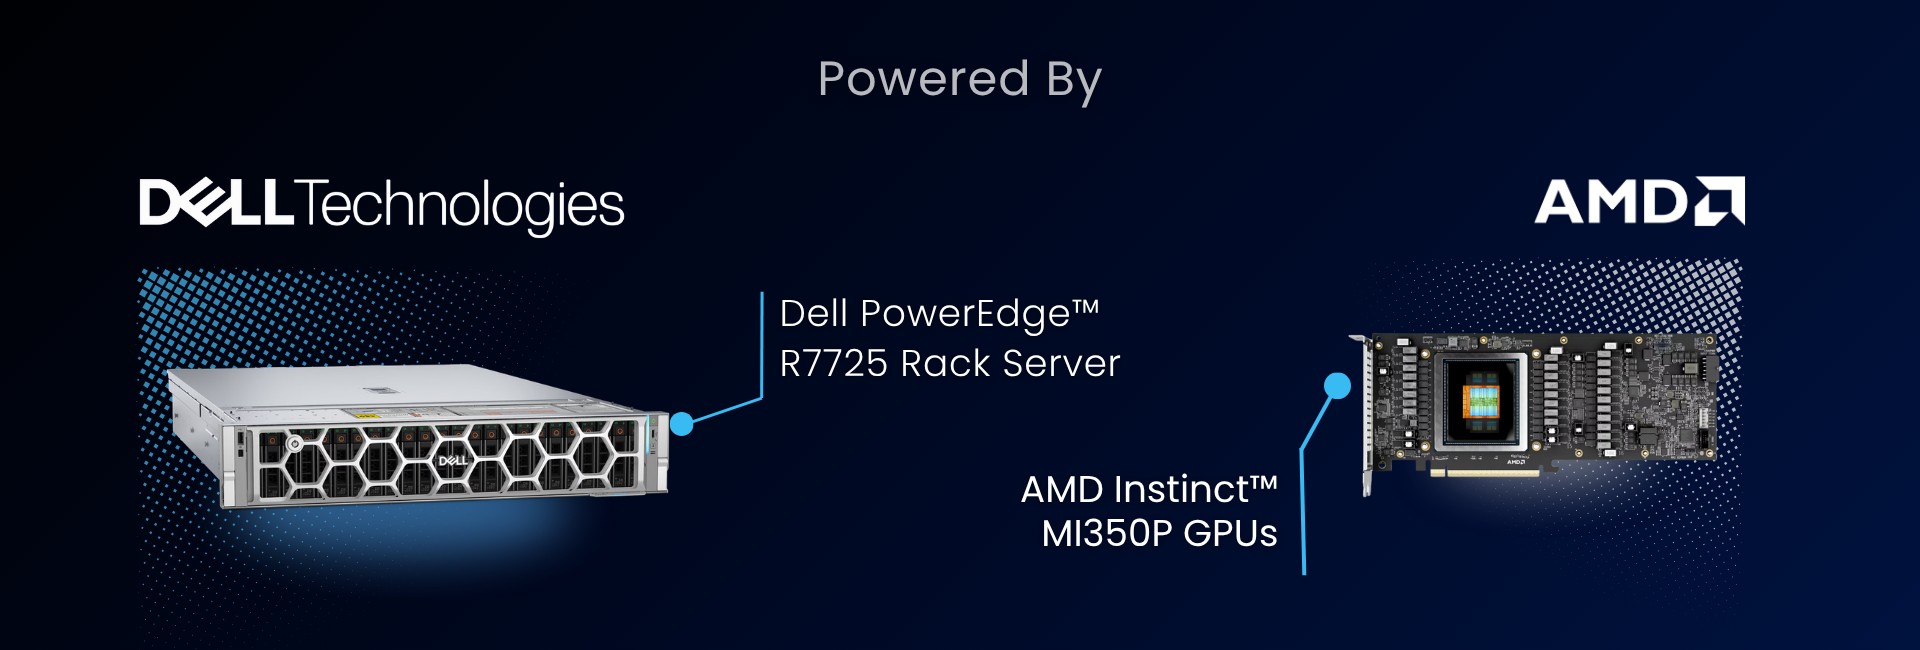
That demand is what this study measures. AMD named the tier that carries it at Advancing AI 2026, calling it the agent sandbox CPU.[2] Metrum AI quantified it on a single node running the model-serving tier and the agent sandboxes together. The accelerators served the same agents whose host-CPU work we measured. We ran three agentic coding workloads from Terminal-Bench 2.0, a public benchmark whose tasks ship with objective pass/fail graders, on a Dell PowerEdge™ R7725: a 2U dual-socket air-cooled server with two AMD Instinct™ MI350P PCIe® accelerators at 144 GB HBM3E each and two AMD EPYC™ 9555 processors giving 128 cores and 256 threads. Every run served the same model, Ornith-1.0-35B at FP8. For each workload we measured the CPU core-seconds consumed against the GPU busy-seconds delivered.
On that one server, with one model and one agent framework, demand ranged from 1.07:1 to 18.21:1, every workload at or above CPU:GPU parity, a swing of roughly 17× driven by which workload was running and the density it sustained. The conclusion for anyone sizing this infrastructure is that there is no universal CPU:GPU ratio to design against. The ratio belongs to the workload and its operating point, and it has to be measured or mapped. A companion characterization on a Dell PowerEdge XE9785 with eight AMD Instinct MI355X accelerators traced the same behavior on its own terms.
Getting this wrong is expensive in both directions. The same server sustained 512 agents on one workload and 60 on another, so a sizing assumption that ignores workload character can be off by more than eight times in node count. Over-provision the host and accelerator capital sits underused. Under-provision it and the accelerators wait on a compiler, which is the most expensive idle time in the data center.
All three workloads are Terminal-Bench 2.0 coding tasks, so these figures characterize terminal and software-engineering agents. Retrieval, sub-agent fan-out and KV-cache management are not exercised here, so for a retrieval-heavy production agent the measured host demand is a floor.
THE AGENTIC SHIFT
What an AI agent actually does to a server
Ask a chatbot a question and the work is easy to picture: text in, the model runs on a GPU, text out. Give an agent a task and it stops answering and starts working. It writes code, runs it, reads the results, and decides what to try next, dozens of times over. Only one of those steps is the model thinking; the rest is launching shells, compiling source, executing scripts and reading files, and none of it runs on the GPU. The GPU never got slower. The workload around it grew.
So the practical question for anyone buying this hardware is: how many CPU core-seconds of work does one second of GPU work drive alongside it?
On a single Dell PowerEdge R7725, across three coding tasks from the same public benchmark suite, the ratios ran from 1.07:1 to 18.21:1; the companion characterization on the Dell PowerEdge XE9785 traced the same shape on its own terms, from 0.70:1 to 9.62:1. We write these as CPU-cores to GPU, so 1.07:1 means the host worked 1.07 core-seconds for every second the accelerators were busy, and 18.21:1 means it worked more than eighteen. Parity is 1:1. Between those two tasks the demand shifted by roughly 17×, and all three landed on the host-leaning side of parity on the same unchanged server.
Advancing AI 2026: AMD names the tier this study measures
AMD has been making this case all year. In Agentic AI Changes the CPU/GPU Equation, Dan McNamara, AMD's SVP and GM for Compute and Enterprise AI, dismissed the obvious fix outright: "You don't achieve this by simply sprinkling more CPUs into a box of GPUs. You achieve it by adding a newly engineered CPU compute layer."[1] At AMD Advancing AI 2026 on July 23 that argument became a product architecture. Launching the EPYC 9006 Series, AMD described "a three-tier agentic architecture, with each tier creating distinct CPU demand": the agent sandbox CPU that runs the agents, the AI host node CPU that feeds the accelerators, and the general-purpose CPU that carries the databases and application services the agents reach into.[2]
AMD's definition of the first tier maps closely to what this benchmark measures:
| "The agent sandbox CPU runs and coordinates agents, executes spawned code and tasks, manages memory and system state, and handles I/O outside the GPU."[2] |
That is broadly what our instrumentation captures, and AMD put the stakes plainly: "An idle accelerator is the most expensive thing in your data center, and the host CPU is what prevents that idleness."[8] So the practical question is a sizing one: for a given workload blend and model, how much host CPU does each accelerator need beside it to stay busy? That is the input these measurements set out to ground, workload by workload.
Building on AMD's benchmark work
AMD published its own agentic CPU benchmark alongside the launch, decomposing the pipeline into nine stages.[3] Its conclusion aligns with what we observed:
| "Agentic AI performance is not constrained by any single bottleneck. Instead, these workloads continuously transition among networking, orchestration, retrieval, tool execution, data processing, and inference-adjacent activities... agentic AI is fundamentally a systems-level workload."[3] |
That study holds GPU inference fixed by design. It treats inference as an input rather than a variable, which lets it characterize the CPU tier cleanly, and it states plainly that it "does not cover GPU inference performance."[3] This study takes the complementary view, measuring both tiers together under a live agentic workload. Together they answer adjacent halves of one sizing question: how much capability the CPU tier has, and how much of it a workload will draw.
THE DELL POWEREDGE PLATFORM
Dell PowerEdge R7725 with AMD Instinct MI350P: agentic AI on infrastructure you already operate
Characterizing agentic demand is only useful on hardware customers can buy and run today. That was the reason for choosing this platform rather than a specialized high-density configuration.
It is also where AMD expects this workload to land. In its Advancing AI 2026 keynote, AMD framed agentic AI deployment as distributed across frontier, cloud, on-premises and client, and named the on-premises constraints explicitly: power and cooling, cost, and ease of deployment.[4]
The Dell PowerEdge R7725 is a 2U, dual-socket server engineered for dense AI compute and high-capacity NVMe storage in a standard air-cooled rack. It takes AMD Instinct MI350P accelerators in PCIe slots, runs on AMD EPYC 9005-series processors, and is managed through the same tooling an enterprise already uses across its PowerEdge fleet. Moving from demonstration to pilot to production requires platform discipline: validated server design, consistent fleet management, lifecycle and firmware practices, services and support. Dell supplies all of it.
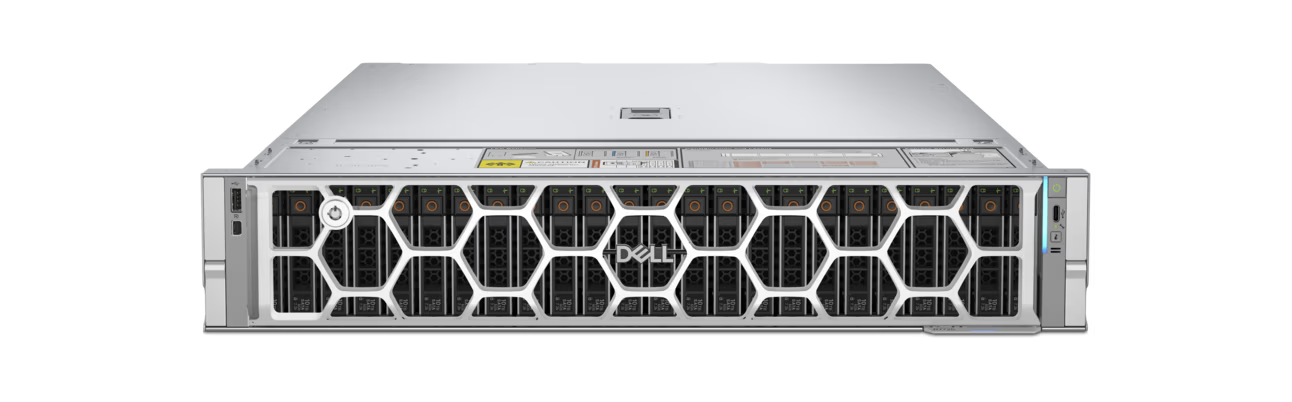
Dell PowerEdge R7725 · 2U dual-socket server
Why the PCIe form factor matters for enterprise deployment
AMD positions Instinct MI350P as "the easiest way to add AI to your data center": standard-server compatible, air-cooled at up to 600 W board power, and capable of holding models up to 260 billion parameters at FP4.[4] It is the PCIe add-in-card member of the MI350 Series, purpose-built for organizations that need agentic and generative AI inside existing air-cooled facilities,[5] and it delivers AMD CDNA™ 4 acceleration without the liquid cooling or specialized chassis that the highest-density accelerator platforms require.
Dell confirmed R7725 support for MI350P from July 2026, describing it as a drop-in deployment into standard air-cooled PowerEdge servers with no data center redesign required.[6] For an enterprise already running PowerEdge on-premises, that makes it the realistic starting point for moving agentic AI from pilot into production without a dependency on cloud inference.
That form factor is also what makes the CPU question concrete. In this configuration, 128 physical CPU cores across two AMD EPYC 9555 processors sit behind two accelerators. Every one of those cores is available for the orchestration, tool execution and sandboxed code work that runs outside the GPU, and because agent CPU demand is intermittent rather than steady, the per-agent quotas that fill them are allowed to sum to more than the physical core count. As the results below show, that host-to-accelerator balance is what allows a single chassis to serve both light-touch agentic generation and sustained host-side computation, and it is the ratio worth checking against any configuration you are considering.
| Component | Role in this study |
|---|---|
| Dell PowerEdge R7725 2U · DUAL-SOCKET · AIR-COOLED | Hosts the full agentic stack: the model-serving tier on the accelerators and every agent sandbox on the host CPUs. Standard rack deployment, no facility change required. |
| AMD Instinct MI350P 144 GB HBM3E · CDNA 4 · PCIe | Serves the reasoning tier. 144 GB per card holds the model with room for long agentic context, so agent loops run without model swapping or a cloud round trip. |
| AMD EPYC 9555 2× PER SERVER · 128 CORES / 256 THREADS | Runs orchestration, tool calls and one isolated code-execution sandbox per agent. This is the tier whose demand this study quantifies. |
Table 1 | Platform under test and the role of each component
| Contributor | What it provides | Why it matters here |
|---|---|---|
| Dell Technologies | Dell PowerEdge R7725 platform, validated server design, lifecycle and firmware practices, services and support. | The air-cooled, standards-based on-premises foundation that makes this a repeatable deployment pattern rather than a lab configuration. |
| AMD | AMD Instinct MI350P PCIe acceleration (144 GB HBM3E, up to 4 TB/s) and AMD EPYC 9555 processors (128 cores / 256 threads per server), with the AMD ROCm™ software stack. | Both tiers of the agentic workload: model reasoning on the accelerators, orchestration and sandboxed execution on the host CPUs. |
| Metrum AI | Instrumented agentic benchmark harness, per-container CPU and per-GPU busy-time accounting, OpenTelemetry span capture, and the AgenticBench dashboard. | The measurement that turns an architecture argument into a number an infrastructure team can size against. |
Table 2 | Contributions to this study
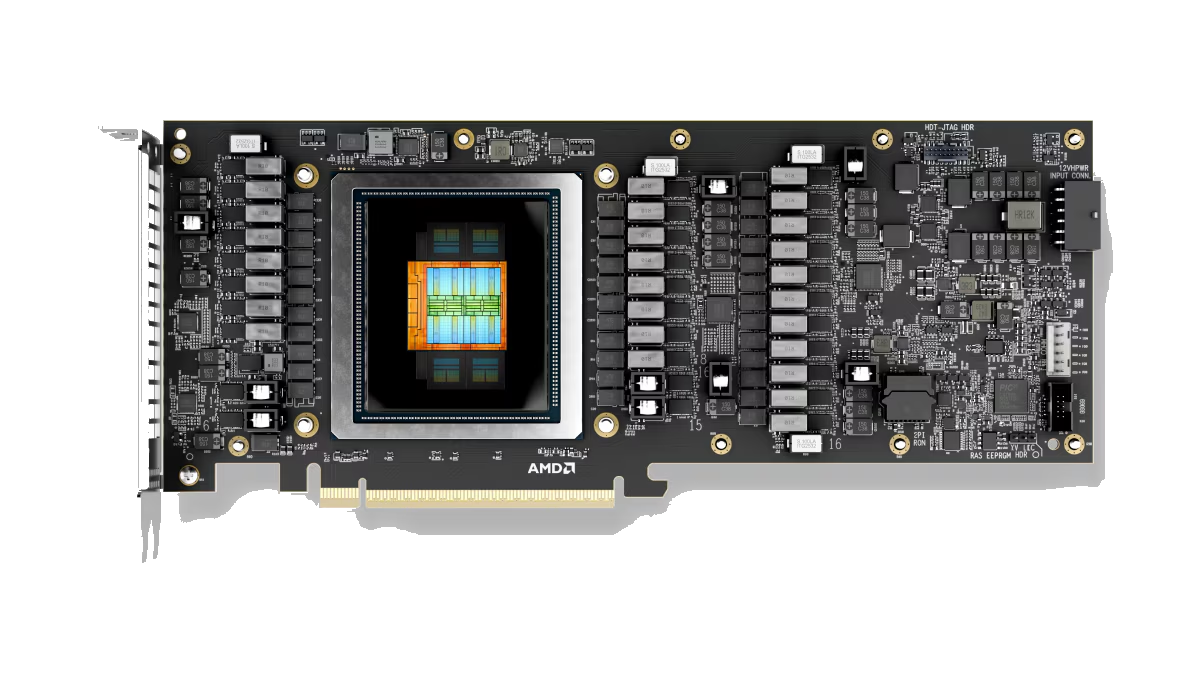
AMD Instinct™ MI350P · AMD CDNA™ 4 · 144 GB HBM3E
| Attribute | AMD Instinct MI350P (published specification) |
|---|---|
| Architecture | AMD CDNA™ 4 |
| Memory | 144 GB HBM3E, 4096-bit interface, 128 MB Infinity Cache |
| Memory bandwidth | 4 TB/s peak |
| Compute units | 128 |
| Peak compute | 4.6 PFLOPs (MXFP4 and MXFP6); 2.3 PFLOPs (FP8) |
| Model capacity | Up to 260 billion parameters at FP4 |
| Form factor | PCIe® 5.0 ×16 add-in card, double slot, passive cooling |
| Board power | 600 W TBP* |
| Precision support | Native MXFP4, MXFP6 and FP8 |
Table 3 | AMD Instinct MI350P published specifications
| Note: *Published AMD specification. The Dell PowerEdge R7725 supports double-width GPUs at up to 450 W, so the MI350P accelerators in this study ran in their 450 W configuration; a 600 W chassis would raise accelerator throughput and, at a fixed fleet size, the measured ratios. |
The system under test
Table 4 records the configuration every figure in this paper was measured on.
| Subsystem | Component and specification |
|---|---|
| Platform | Dell PowerEdge R7725 | 2U dual-socket, air-cooled |
| CPU | 2× AMD EPYC 9555 | 64 c / 128 t per socket | 128 cores / 256 threads total | 8 NUMA nodes |
| GPU | 2× AMD Instinct MI350P (CDNA 4) | 144 GB HBM3E each | PCIe 5.0 ×16 |
| Total GPU memory | 2 × 144 GB | HBM3E |
| System RAM | ~1.5 TB DDR5 |
| Storage | NVMe | 2.9 TB container and model volumes |
| OS | Ubuntu 24.04.4 LTS | Kernel 6.8.0-136-generic |
| GPU driver | ROCm 7.13.0 | amdgpu 6.19.3 |
Table 4 | Hardware specification of the system under test
WHERE THE CPU WORK COMES FROM
AMD calls this tier the agent sandbox CPU: the processor that runs and coordinates the agents, executes the code they spawn, and handles the I/O that never reaches the accelerator.[2] Five distinct sources of demand sit inside that tier, around every call to the model. This study instruments two of them.
Orchestration is the loop itself: deciding what to do next, routing between steps, retrying after failure. Branching logic, largely sequential, on the CPU. Tool calls and sandboxed code execution is the agent running a shell command, editing a file, or compiling a program inside an isolated container on the host. Real computation, sometimes minutes of it, none of which the accelerator can do. At the densities measured here the accelerator is not idle during that work, it is serving other agents, but no part of this work moves off the host. Our instrumentation covers these two.
The remaining three are KV-cache management (bookkeeping for the model's growing conversational memory), sub-agent fan-out (an agent spawning helpers), and retrieval and re-ranking (searching documents to feed the model). These also consume CPU and are not included in these numbers, so a production stack that exercises them draws more host CPU than this study accounts for.
BENCHMARK METHODOLOGY
One definition carries the entire result:
Ratio = CPU core-seconds ÷ GPU busy-seconds. Measured busy time on both sides. Not utilization percentages, and not allocated cores.
Utilization, the percentage a monitoring dashboard reports, is an average across the whole machine over time, and agent CPU work arrives in bursts. A host can average under 10% utilization and still be the precise reason the accelerators sit idle, because the average smooths away the spikes. Allocated cores are worse still: they measure what was provisioned, not what ran.
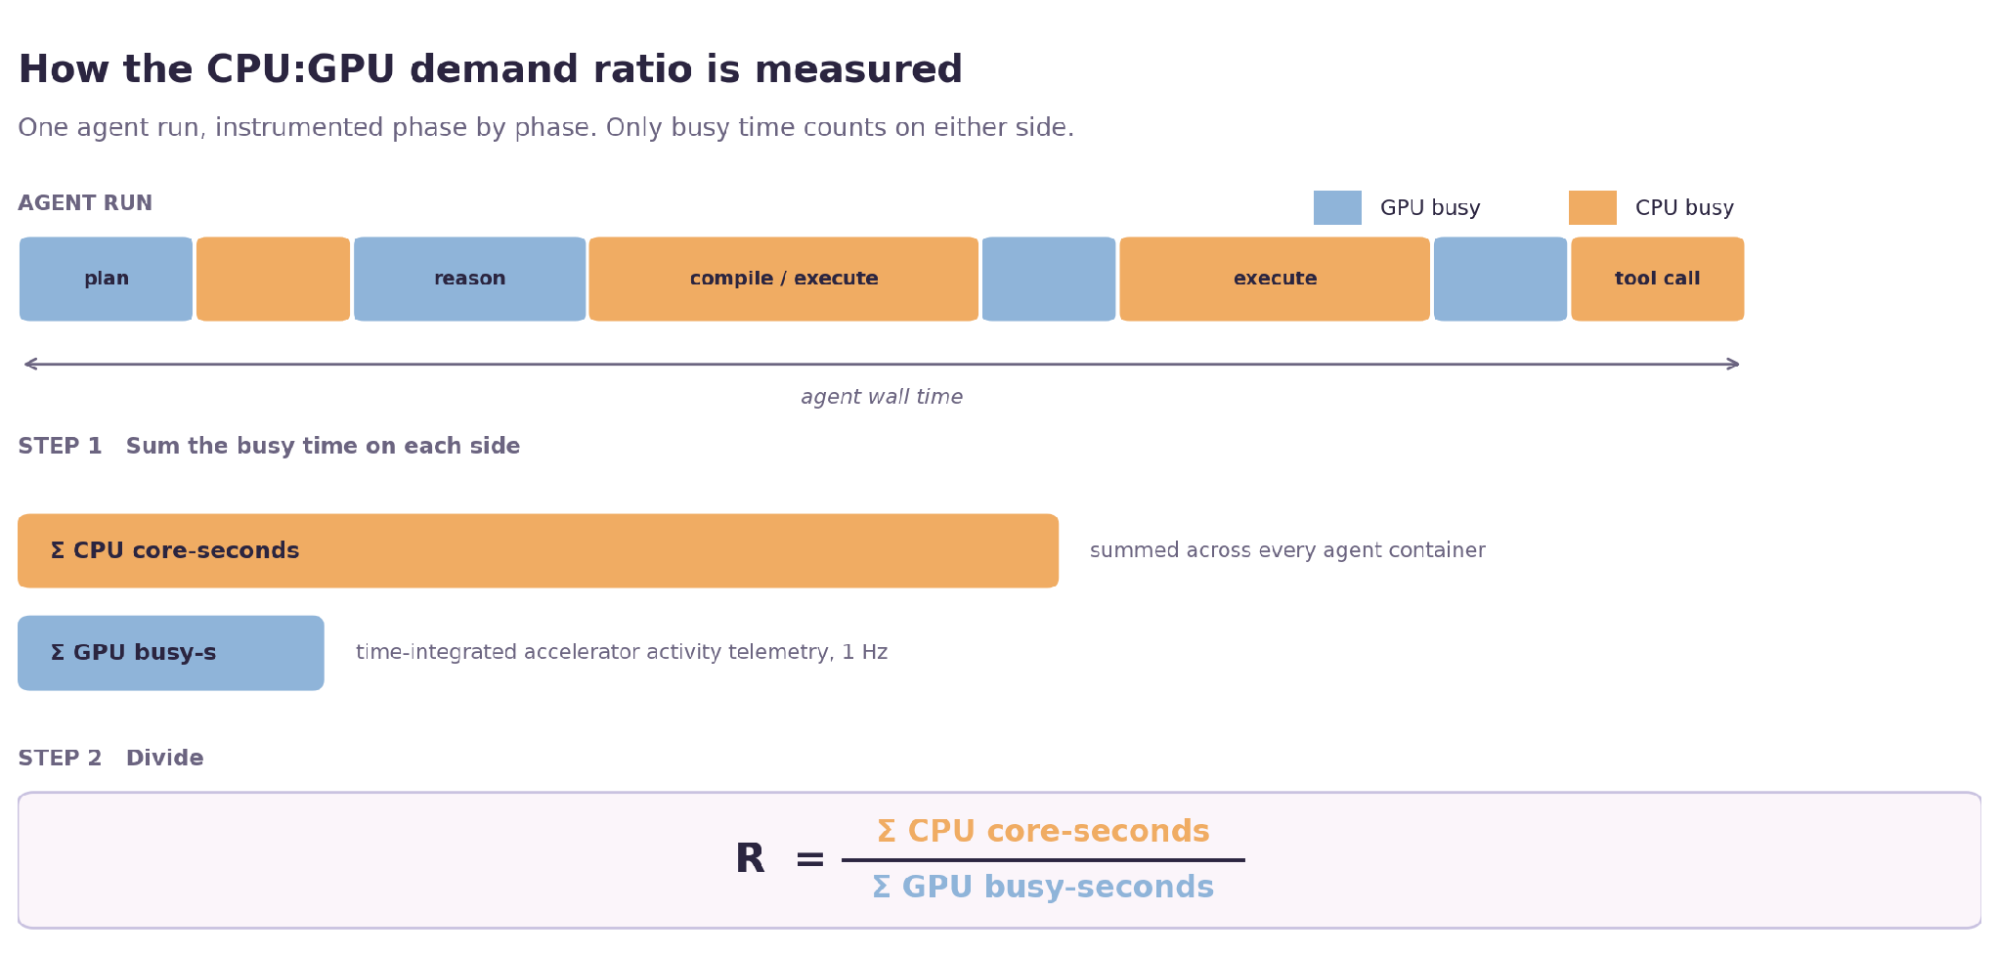
Figure 1 | How the ratio is measured. An agent run alternates between GPU-busy reasoning and CPU-busy tool execution. Busy time is summed independently on each side and divided.
The tasks are not ours. They come from Terminal-Bench 2.0, a public benchmark of 89 hand-written, human-verified terminal engineering tasks, each shipping with its own objective grader.[7] The agent either satisfies the grader or it does not. This is why every number here carries a pass rate, and why we report only operating points at or above 80% graded pass, with one flagged exception noted under Table 9.
| Item | Definition |
|---|---|
| Quantity measured | R = CPU core-seconds ÷ GPU busy-seconds over the same window |
| CPU numerator | CPU time consumed by each agent sandbox, read once per second from the operating system's own per-container accounting |
| CPU exclusions | Model-serving, load-balancer and telemetry CPU measured separately and excluded from the agent figure |
| GPU denominator | Time each accelerator spent actively working, sampled once per second from AMD device telemetry and integrated across the run |
| Measurement window | Per-agent active window, first to last span including verification. Windows include time spent waiting on the GPU |
| Core quota per agent | Taken from each Terminal-Bench 2.0 task's own resource declaration: 1, 1 and 4 cores. Allocated per sandbox rather than reserved against physical cores; the ratio counts CPU time consumed, never cores granted |
| Pass criterion | Every grader reward reaches 1.0. Binary pass or fail, no partial credit |
| Evidence filter | Only operating points at or above 80% graded pass rate are quoted, with one flagged exception on the companion platform (see Table 9) |
Table 5 | Measurement definitions
| Component | Version | Role / Notes |
|---|---|---|
| Model | Ornith-1.0-35B-FP8 | 35B Parameter - MoE model, FP8 weights; served identically across every run |
| Serving | vLLM on AMD ROCm | vLLM v0.25.1 | max_num_seqs 256 | context length 131072 | GPU memory utilization 0.90 | TP=1 | 2 Replicas | nginx least-connection routing |
| Agent framework | deepagents on LangGraph | One Docker sandbox per agent | hard CPU quota | step cap 50 |
| Benchmark | Terminal-Bench 2.0 | Unmodified tasks | objective graders |
| Observability | OpenTelemetry | Every agent phase recorded as a span |
Table 6 | Core software stack under test
A note on the core quota per agent. Each agent runs in its own Docker sandbox under a fixed CPU quota of one, one or four cores, taken directly from the resource declarations that ship with each Terminal-Bench 2.0 task rather than tuned here, then validated against graded pass rate. The quota is therefore a consequence of the workload, not a variable chosen to produce a particular number. Those quotas are allocated, not reserved: at the densities reported below they sum to more than the host's 128 physical cores, which is workable only because agent CPU work is bursty. An agent spends most of its window waiting on the model rather than computing. The ratio also counts consumed CPU time only: an agent granted four cores that uses one reports one.
PERFORMANCE RESULTS
Result 1: Demand spans 17× on one Dell PowerEdge R7725
| Workload | Cores per agent | Agents sustained | Pass rate | Measured ratio |
|---|---|---|---|---|
| pypi-server | 1 | 512 | 86% | 1.07:1 |
| sqlite-with-gcov | 1 | 238 | 95% | 6.69:1 |
| mcmc-sampling-stan | 4 | 60 | 85% | 18.21:1 |
Table 7 | Measured CPU:GPU demand on the Dell PowerEdge R7725 with 2× AMD Instinct MI350P
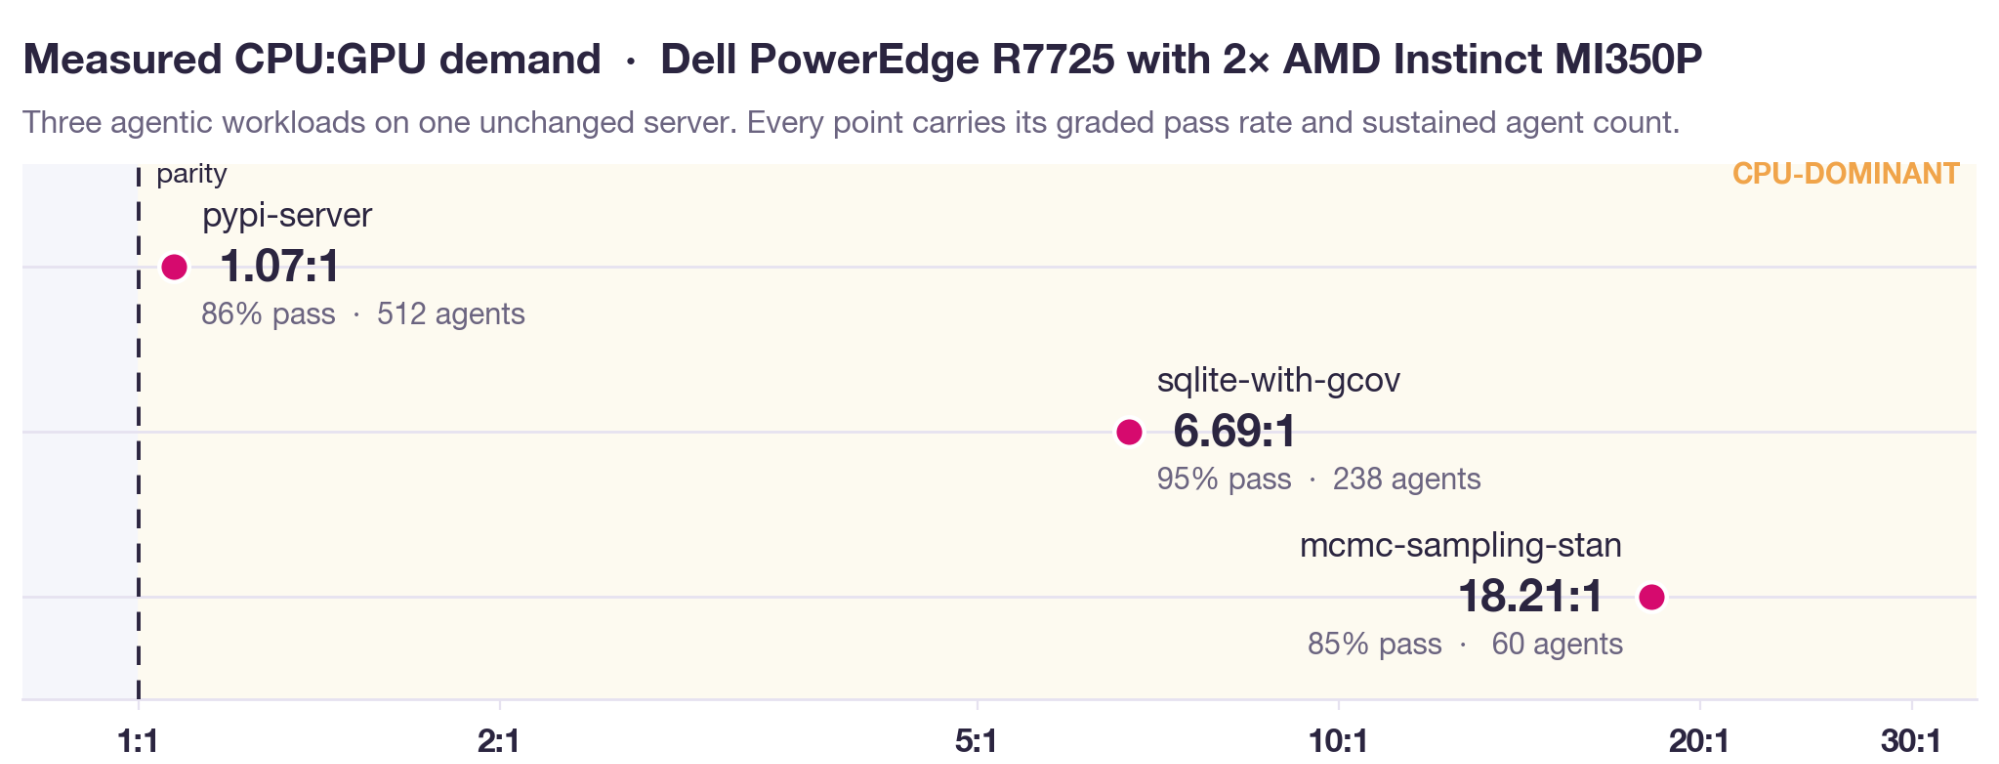
Figure 2 | Measured CPU:GPU demand across three agentic workloads on the Dell PowerEdge R7725 with 2× AMD Instinct MI350P, plotted on a log scale against 1:1 parity. Pass rates and sustained agent counts shown with each point.
| Note on agent counts: each figure is the highest density at which that workload held every stability gate (agent-deadline rate, infrastructure success, quality retention, resource faults and measurement integrity), found by sweeping concurrency upward until a gate fired, not a count chosen in advance. pypi-server bracketed between 512 and 574 agents, sqlite-with-gcov between 238 and 256, and mcmc-sampling-stan between 60 and 64. Because each ceiling is discovered rather than set, the three points do not allocate the same total CPU: 512 × 1, 238 × 1 and 60 × 4 cores, against a host presenting 128 physical cores and 256 threads. |
| Note on platform maturity: the AMD Instinct MI350P accelerators and the ROCm stack used here are early in their deployment lifecycle. Both will mature, and the absolute ratios in this study should be read as an August 2026 snapshot rather than a ceiling. What maturation changes is the value of each ratio, not the finding that demand varies by workload on unchanged hardware. |
One server, one model, three tasks, and the ratio moves by roughly 17× between the ends (18.21 ÷ 1.07). What each task does explains why the gap is that wide, and why none of the three came out accelerator-dominant once the server was full.
pypi-server asks the agent to write a Python package and serve it from a local index. Mostly the model writing code, with short tool calls between turns. At 512 concurrent agents it measured 1.07:1, just above parity, at 86% graded pass. Per agent the split runs the other way: 12 seconds of tool time against 333 seconds of model time. Density is what closes the gap, because two accelerators are shared across all 512 agents while each agent's CPU time is its own.
sqlite-with-gcov asks it to compile SQLite with code-coverage instrumentation and fix the resulting build errors. The model reasons through compiler output while the C compiler does the work on the host. At 238 agents it measured 6.69:1 at 95% graded pass, the one workload here that met every stability gate and all three absolute thresholds outright: 12,021 CPU core-seconds against 1,796 GPU busy-seconds over the same window.
That pair is worth pausing on, because both tasks ran at an identical one-core quota and differ only in what the agent does with it. pypi-server sat at parity; sqlite-with-gcov sat more than six times past it. Nothing about the hardware or the allocation distinguishes them.
The allocation numbers make the same point more sharply. sqlite-with-gcov ran 238 agents at one core each, and mcmc-sampling-stan ran 60 at four: 238 allocated cores against 240. Two workloads granted the same CPU on the same server, and their measured demand differs by a factor of 2.7. Allocated cores predict nothing.
mcmc-sampling-stan takes that further. It asks the agent to write a statistical model, compile it, and run a computationally heavy sampling simulation. The writing is brief. The simulation is not: sustained, multi-core numerical work on the CPU. At 4 cores per agent and 85% graded pass across 60 agents, it measured 18.21 CPU core-seconds per GPU busy-second, 56,543 against 3,104, with the accelerators averaging 83.4% and 71.5% utilization rather than the 99% they held on the other two tasks. The same R7725 that sat at parity on pypi-server is host-bound here by a factor of more than eighteen.
This is the result that matters for provisioning. A single class of agentic workload can move the binding resource by more than an order of magnitude on an unchanged server. On this platform, 64 host cores per accelerator sustained 60 agents at 85% graded pass. The same run missed its throughput and energy targets at every density tested. Because we did not test a thin-host configuration, we make no claim about the core count at which pass rates would start to fall.
The table reaches its own conclusion. There is no universal CPU:GPU ratio. The ratio is a property of the workload and its operating point. It is not a property of the workload alone: because its denominator is one accelerator's busy time, the same workload reports a different ratio on a different accelerator. The same server behaves like three different machines depending on what you ask of it. That is the measured expression of AMD's systems-level-workload conclusion.[3]
Result 2: Capacity has to be discovered, and averages hide the burst
A single measurement at a single load level is not a characterization either. Each ceiling above was found by walking concurrency upward until a gate fired, and where that happened differed by an order of magnitude between workloads. pypi-server held to 512 agents and broke at 574 on agent-deadline rate and the latency ceiling. sqlite-with-gcov held to 238 and broke at 256 on the same two gates. mcmc-sampling-stan sustained 60, with 64 sitting inside measurement noise of its latency ceiling. None of that is predictable from the per-agent ratio. It has to be swept.
The burst behavior is what actually determines the hardware you need. Whole-node host CPU averaged 5.1% on pypi-server, 8.5% on sqlite-with-gcov and 13.1% on mcmc-sampling-stan, and peaked at 47.0%, 48.4% and 75.0% respectively, between five and ten times its own average in every case. Measured sandbox core use has the same shape: 2.2 cores in use on average against 19.8 at peak for pypi-server, 13.3 against 33.3 for sqlite-with-gcov, and 28.1 against 70.0 for mcmc-sampling-stan. The run queue puts it more bluntly still. At those same operating points, peak counts of processes waiting for a core reached 202 on pypi-server, 238 on sqlite-with-gcov and 290 on mcmc-sampling-stan. The accelerators move too, in the opposite direction: GPU utilization averaged 98.9% and 98.5% across the pypi-server and sqlite-with-gcov runs, held at 99% or above for most of each, but fell to 77.4% on mcmc-sampling-stan, 83.4% on one card and 71.5% on the other, because agents that spend most of their wall time in CPU-bound sampling have less to hand back to the model. Averages hide the bursts you have to buy for, and neither a host judged by a 13% mean nor an accelerator judged by a headline utilization figure would have told you what these runs actually did.
At the pypi-server and sqlite-with-gcov ceilings the accelerators were the binding resource, not the host: GPU utilization sat near 99% while host CPU averaged 5 to 9 percent. On those two workloads this platform is accelerator-bound, and the host-core argument applies to workloads like mcmc-sampling-stan that sustain host-side computation.
These two findings are not in tension. The ratio measures how much host work a workload generates for every second of accelerator work. It does not identify which resource saturates first. On pypi-server and sqlite-with-gcov the accelerators saturate first even though the host performs most of the busy time, because two cards are shared across hundreds of agents while each agent's CPU time is its own. On mcmc-sampling-stan the host binds instead, and accelerator utilization falls to 77%. Both quantities matter, and neither substitutes for the other.
Result 3: Node power is nearly flat across workloads; energy per task is not
System power was sampled on the R7725 throughout every run: whole-node draw and CPU package power, alongside an accelerator-scope energy estimate the harness reports separately. Two findings.
Node power barely moved; the work behind it moved enormously. Mean whole-node draw sat within 110 W of itself across all three workloads, from 1,619 to 1,728 W, and peak draw within 26 W, from 1,986 to 2,012 W. A power reading on its own would have told you nothing about which workload was running, or how much of it was getting done.
The energy cost of finishing a task, by contrast, depends almost entirely on the workload.
| Workload | Agents | Mean / peak node power | Mean / peak CPU package power | Energy per passed task | Electricity per passed task |
|---|---|---|---|---|---|
| pypi-server | 512 | 1.64 / 2.01 kW | 403 / 517 W | 0.94 Wh | $0.00011 |
| sqlite-with-gcov | 238 | 1.73 / 1.99 kW | 474 / 581 W | 1.94 Wh | $0.00023 |
| mcmc-sampling-stan | 60 | 1.62 / 2.00 kW | 514 / 750 W | 17.7 Wh | $0.00212 |
Table 8 | Power, energy and electricity cost by workload, Dell PowerEdge R7725
These three tasks do different amounts of work, so the spread reflects the work, not a hardware efficiency result. What the numbers do show is that node power is a poor proxy for that work: mean draw stayed inside a 110 W band while electricity per passed task ran across a 19x range, and the workload with the lowest mean draw was the most expensive per task. Power-based capacity planning therefore carries almost no information about throughput or cost. Model the economics per passed task against your workload mix instead.
In planning units that is roughly $113, $233 and $2,124 per million completed tasks for pypi-server, sqlite-with-gcov and mcmc-sampling-stan.
| Note: energy per passed task is the harness's own gate metric at the operating point shown. Cost figures are electricity only, applying a $0.12/kWh assumption to that measured energy. They exclude hardware amortization, cooling overhead beyond the server's own draw, licensing and staff, and are not comparable to total-cost-of-ownership figures. The accelerator-scope GPU energy figure the harness reports is an estimate (mean per-GPU power × step duration) and is not used here. |
Companion characterization: Dell PowerEdge XE9785 with 8× AMD Instinct MI355X
We ran the same three workloads, the same model and the same benchmark on a second Dell platform, the PowerEdge XE9785 with two AMD EPYC 9655 processors and eight AMD Instinct MI355X accelerators.
| Workload | Cores per agent | Agents sustained | Pass rate | Measured ratio |
|---|---|---|---|---|
| pypi-server | 1 | 672 | 75% | 0.70:1 |
| sqlite-with-gcov | 1 | 238 | 87% | 1.67:1 |
| mcmc-sampling-stan | 4 | 92 | 83% | 9.62:1 |
Table 9 | Measured CPU:GPU demand on the Dell PowerEdge XE9785 with 8× AMD Instinct MI355X. pypi-server held a 75% graded pass rate on this platform across the ladder and is published at that observed rate as the flagged exception to the 80% filter.
Read each platform on its own. The two servers differ in accelerator count, host core count and agents per accelerator at once, so no conclusion about one platform's hardware relative to the other follows from setting the numbers side by side. What this measurement establishes on its own is the same shape the R7725 showed: demand runs from GPU-dominant to CPU-dominant and crosses parity along the way, here from 0.70:1 on pypi-server to 9.62:1 on mcmc-sampling-stan.
MAKING THE HANDOFF VISIBLE
We built a dashboard, AgenticBench, so none of this has to be taken on trust. Every phase of every agent run is recorded as an OpenTelemetry span, so the headline number and the picture on screen come from the same data. The dashboard does not illustrate the result. It reports it.
Its centerpiece is a swimlane where GPU-busy and CPU-busy time alternate down a single timeline. The handoff is constant, and through every tool call and compile the accelerators do no work for that agent. Phase attribution across the agent loop and server telemetry surround it.

Figure 3 | AgenticBench agent swimlane, showing GPU-busy and CPU-busy intervals across one pypi-server agent run.
CONCLUSION
Neither the hardware nor a single ratio settles this. The Dell PowerEdge R7725 with AMD Instinct MI350P accelerators and AMD EPYC 9555 processors pairs 144 GB of HBM3E per card with 128 host cores, a platform that serves both light-touch agentic generation and sustained host-side computation on the same chassis. What determines whether that investment scales is knowing which of those two profiles your workloads produce.
The measurements are unambiguous on that point. Across three unmodified Terminal-Bench 2.0 tasks on a single R7725, CPU:GPU demand spanned roughly 17× and never fell below parity, with every figure carrying a graded pass rate at or above 85%. Electricity cost per passed task varied 19× across the same three workloads on hardware that never changed, and the agent density one server sustained varied by a factor of eight and a half.
| The workload sets the number One server, one model, 1.07:1 to 18.21:1. A single ratio taken into procurement will be wrong in one direction or the other. | Tool execution is a compute tier Sandboxed code and shell commands are not overhead around the model. At full density, CPU core-seconds exceeded GPU busy-seconds on every workload here. | Size for peaks, not averages Host CPU averaged 5-13% and peaked at 75%. Provision for the burst, and read every ratio with its pass rate. |
For enterprise architects sizing agentic AI infrastructure: accelerator capacity is necessary and not sufficient. The host CPU tier beneath it determines whether your accelerators generate tokens or wait on a compiler. Workloads that sit near parity are well served by conventional accelerator-dense sizing. Anything that compiles, samples, simulates or executes at length needs the host core count planned as deliberately as the accelerator count, and the only way to know which one you have is to measure it on your own tasks, at your own concurrency, on the server you actually intend to buy. Both tiers are therefore sized from the measured work profile and its operating point, not from accelerator count or a fixed CPU:GPU ratio.
APPENDIX A: WORKLOAD DEFINITIONS
All three are unmodified Terminal-Bench 2.0 tasks, drawn from a suite spanning software engineering, scientific computing, systems administration and security.
| Task | What the agent must do | CPU character |
|---|---|---|
| pypi-server | Write a Python package and serve it from a local package index | Light: short tool calls between long code-generation turns |
| sqlite-with-gcov | Compile SQLite with code-coverage instrumentation and fix the resulting build errors | Bursty: the C compiler does real work between reasoning turns |
| mcmc-sampling-stan | Write a statistical model, compile it, and run a computationally heavy sampling simulation | Dominant: sustained multi-core numerical compute |
Table 10 | Workloads under test
APPENDIX B: DENSITY SWEEP EVIDENCE
Measured on the Dell PowerEdge R7725. Each ceiling in Table 7 was found by walking concurrency upward until a stability gate fired; the levels below are the ones recorded.
| Task | Densities recorded | Highest density that held every stability gate |
|---|---|---|
| pypi-server | 1 · 2 · 12 · 32 · 64 · 115 · 128 · 256 · 512 · 574 · 779 · 1,024 | 512 at 86.1% pass; 574 fired agent-deadline rate and the latency ceiling |
| sqlite-with-gcov | 1 · 2 · 12 · 32 · 64 · 115 · 128 · 176 · 210 · 238 · 256 | 238 at 95.0% pass; 256 fired agent-deadline rate and the latency ceiling |
| mcmc-sampling-stan | 1 · 2 · 3 · 8 · 16 · 28 · 32 · 60 · 64 | 60 at 85.0% pass; 64 sat inside measurement noise of the latency ceiling; energy and goodput thresholds unmet at every density swept |
Table 11 | Densities recorded and the ceiling each workload held, Dell PowerEdge R7725
The three ceilings differ by a factor of eight and a half on the same server, the same model and the same harness. Read the lists as the range each workload was swept across; the ceiling is the highest level in it that held, not the highest level attempted.
APPENDIX C: COMPANION PLATFORM CONFIGURATION
| Subsystem | Component and specification |
|---|---|
| Platform | Dell PowerEdge XE9785 | 8-way accelerator platform |
| CPU | 2× AMD EPYC 9655 | 96 c / 192 t per socket | 192 cores / 384 threads total |
| GPU | 8× AMD Instinct MI355X (CDNA 4) | 288 GB HBM3E each |
| Total GPU memory | 8 × 288 GB | HBM3E |
| System RAM | ~1.5 TB DDR5 |
| OS | Ubuntu 24.04.4 LTS | Kernel 6.8.0-124-generic |
| GPU driver | ROCm 7.2.4 | amdgpu 6.16.13 |
Table 12 | Dell PowerEdge XE9785 companion configuration
REFERENCES
| 1. | Dan McNamara, "Agentic AI Changes the CPU/GPU Equation," AMD, May 7, 2026. https://www.amd.com/en/blogs/2026/agentic-ai-changes-the-cpu-gpu-equation.html |
| 2. | "AAI 2026: 6th Gen AMD EPYC Server CPUs Power the Agentic Data Center," AMD Newsroom, July 23, 2026. https://newsroom.amd.com/news/aai-2026-6th-gen-epyc/ |
| 3. | Raghu Nambiar, "Agentic AI: AMD EPYC 9005 CPUs Wins Today, EPYC 9006, formerly code-named 'Venice', Takes It to a New Level," AMD, July 23, 2026. https://www.amd.com/en/blogs/2026/agentic-ai-amd-epyc-9005-cpus-wins-today-epyc-9006.html |
| 4. | AMD Advancing AI 2026 keynote presentation, July 23, 2026. https://newsroom.amd.com/press-kits/advancing-ai-2026-all-news/ |
| 5. | Suresh Andani, "AMD Instinct MI350P PCIe GPUs: Run Enterprise AI on Your Existing Infrastructure," AMD, May 7, 2026. https://www.amd.com/en/blogs/2026/amd-instinct-mi350p-pcie-gpus-run-enterprise-ai-on-your.html |
| 6. | Varun Chhabra, "Dell and AMD Are Expanding What's Possible for On-Premises AI," Dell Technologies, May 7, 2026. https://www.dell.com/en-us/blog/dell-and-amd-are-expanding-what-s-possible-for-on-premises-ai/ |
| 7. | "Terminal-Bench: Benchmarking Agents on Hard, Realistic Tasks in Command Line Interfaces," arXiv:2601.11868. https://arxiv.org/abs/2601.11868 |
| 8. | Madhu Rangarajan, "The Agentic Era Runs on a CPU Foundation - and It's Called AMD EPYC 9006 Series Server CPUs," AMD, July 23, 2026. https://www.amd.com/en/blogs/2026/the-agentic-era-runs-on-a-cpu-foundation-and-it-s-called.html |
| 9. | Madhu Rangarajan, "Advancing Agentic Workflows With AMD EPYC 9006 Series Server CPUs," AMD, July 23, 2026. https://www.amd.com/en/blogs/2026/advancing-agentic-workflows-with-amd-epyc-9006-series.html |
| 10. | Dan McNamara, "Agentic AI Isn't One Workload. It's an End-to-End Workflow.," AMD, June 29, 2026. https://www.amd.com/en/blogs/2026/agentic-ai-isnt-one-workload-its-an-end-to-end-workflow.html |
| 11. | Raghu Nambiar, "Agentic AI Needs Rack-Scale CPU Performance - AMD EPYC Delivers It Today," AMD, June 9, 2026. https://www.amd.com/en/blogs/2026/agentic-ai-needs-rack-scale-cpu-performance-amd-epyc.html |
| 12. | "AMD Rack-Scale Agentic AI Methodology Description," AMD, June 2026. https://www.amd.com/content/dam/amd/en/documents/solutions/ai/methodology-description.pdf |
| 13. | "AMD Instinct MI350P Accelerator," AMD product page. https://www.amd.com/en/products/accelerators/instinct/mi350/mi350p.html |
| 14. | "AMD Instinct MI350P Product Brochure," AMD, 2026. https://www.amd.com/content/dam/amd/en/documents/epyc-business-docs/other/amd-instinct-mi350p-product-brochure.pdf |
| 15. | "Introducing AMD ROCm Infera: Scaling Goodput for Agentic AI with Distributed Inference Orchestration," AMD ROCm Blogs, July 23, 2026. https://rocm.blogs.amd.com/software-tools-optimization/infera-di/README.html |
| 16. | Terminal-Bench, benchmark and evaluation harness. https://www.tbench.ai/ |
| 17. | vLLM inference and serving engine. https://docs.vllm.ai/ |
| 18. | AMD ROCm documentation. https://rocm.docs.amd.com/ |
DISCLOSURES
Testing performed by Metrum AI in collaboration with Dell Technologies and AMD. All performance figures represent observed measurements under the described test conditions on a single Dell PowerEdge R7725 configuration. Results vary by model, hardware configuration, software version, cache state and deployment workload, and should not be interpreted as guarantees of performance on different systems. The finding that CPU:GPU demand varies by workload and operating point, and has to be measured per workload rather than assumed from a single ratio, is the transferable result. Table 13 lists the full set of limitations and disclosures that apply to every figure in this document.
Statements attributed to AMD and Dell Technologies are quoted from the published sources listed in the references. Market-size, growth-rate and adoption figures are AMD's own published forecasts and survey findings, reproduced here with attribution; they are forward-looking statements of AMD's expectations, not measurements from this study, and not projections by Metrum AI or Dell Technologies.
AMD, the AMD Arrow logo, AMD CDNA, AMD Instinct, EPYC, ROCm, and combinations thereof are trademarks of Advanced Micro Devices, Inc. Dell, Dell Technologies, and PowerEdge are trademarks of Dell Inc. or its subsidiaries. Other product and company names used in this publication are for identification purposes only and may be trademarks of their respective owners.
Copyright © 2026 Metrum AI, Inc. All Rights Reserved.
LIMITATIONS
| Item | Detail |
|---|---|
| Single measured runs | Each quoted figure is one realized measured run at the stated operating point, selected on graded pass rate and gate cleanliness rather than on the ratio it produced. Figures are not averages across repeats and no confidence intervals are applied |
| Where variance sits | CPU accounting is drawn from per-container kernel counters and is stable. GPU busy time and realized throughput vary with how requests distribute across serving replicas, so GPU-side figures should be read as one measured operating point rather than a stable mean |
| Scope of the CPU measurement | The ratio reflects orchestration and tool execution, the two CPU sources this benchmark instruments. KV-cache management, sub-agent fan-out and retrieval also consume CPU and are not included, so a full production agentic stack would draw more host CPU than reported here |
| Prefix caching enabled | vLLM prefix caching was active, as it would be in production. Repeated context therefore consumes less GPU time than an uncached configuration would, and the measured ratios reflect that |
| Measurement windows | Each agent's window runs from its first to its last recorded span, including verification, and includes intervals in which the agent was waiting on the GPU. CPU core-seconds accrue only while the CPU is actually busy |
| CPU quota allocation | Per-agent CPU quotas are allocated per sandbox and are not reserved against physical cores. At the reported densities the allocated quotas sum to more than the host's 128 physical cores, so those densities are reachable only because agent CPU demand is intermittent. Measured concurrent sandbox core use stayed well below the allocated total at every level |
| Operating points quoted | One operating point per workload is reported: the highest density at which that workload held every stability gate. Not every absolute threshold was met at those points: pypi-server's goodput gate could not be evaluated at 512 agents, and mcmc-sampling-stan missed the energy and goodput thresholds at every density tested |
| Power scope | Whole-node power and CPU package power were sampled on the R7725 throughout. The GPU energy figure the harness reports is an accelerator-scope estimate derived from mean per-GPU power and step duration, not a measurement, and no tier-by-tier power split is claimed |
| Cost scope | Electricity only, applying $0.12/kWh to measured energy. Excludes capital cost, facility overhead beyond the server's own draw, licensing and staff. Not comparable to total-cost-of-ownership figures |
| Single server, agentic workloads | All results are single-server and cover agentic workloads. No pure model-serving baseline is included |
| Model and stack specific | Specific to Ornith-1.0-35B at FP8, one serving replica per accelerator, and this agent framework. A different model, precision or framework would shift the numbers |
| Workload selection | Three deliberately contrasting tasks were chosen to establish the range of demand, not to represent a typical enterprise workload mix. This is why the study's recommendation is to measure your own mix |
| Platform maturity | The MI350P accelerators and the ROCm 7.13.0 stack used here are early in their deployment lifecycle; AMD's own MI350P launch testing used ROCm 7.14.0. Accelerator firmware, driver and serving-stack maturation will change the measured ratios in both directions, since improvements target host-side overhead as well as accelerator throughput. These figures are a snapshot of August 2026 and are not a performance ceiling for the platform. |
| No cross-platform comparison | The two servers differ in accelerator count, host core count and agents per accelerator at once. Each characterization stands alone, and no relative hardware conclusion is drawn or implied. |
Table 13 | Limitations and disclosures