How Dell, Broadcom and Metrum AI correlated compute, network and storage telemetry to identify a silent RoCE back-pressure condition and stage a governed remediation.
Field Note · Autonomous Operations · Dell-Broadcom AI Lab · Infra & Networking · ~9 min read
Executive Takeaway
AI infrastructure can report healthy status while a workload runs slower than the team expects. Links stay up, drop counters stay at zero, and throughput dashboards look ordinary. The difficulty is not detecting an error. It is connecting a suspected slowdown to the specific host, NIC, switch interface and queue behavior behind it.
In the Dell-Broadcom AI Lab, an agent workflow correlated Broadcom RoCE NIC counters, Dell PowerSwitch interface telemetry and LLDP topology data for two hosts attached to a single leaf switch. That correlation localized a suspected receiver-side back-pressure condition and produced a ranked recommendation for human review.
The result is a practical validation of Dell's AI Factory operating model: AI infrastructure is not complete when it is installed; it must also be observable, governed, and ready to operate at scale.
Key Results at a Glance
01 · THE OPERATIONAL CHALLENGE
Large-model training depends on synchronized collective operations. When one receiver cannot drain data quickly enough, other GPUs can wait even though links remain up, switch drop counters remain at zero, and throughput dashboards look normal. The operational problem is not simply detecting an error; it is connecting the user-visible slowdown to the specific host, NIC, switch port, and queue behavior that caused it. This is a gray failure: the infrastructure's self-view appears healthy while the workload experiences degraded performance.
GPUs Talk Over a Lossless Fabric: Between Nodes, Not Within Them
Inside a node, GPUs talk over a proprietary intra-node link (NVLink on the H200 systems, Infinity Fabric on the MI300X systems), fast enough that eight GPUs on one baseboard behave like a single large accelerator. This failure does not live there. It lives the moment a collective operation crosses to another node and depends on the Ethernet fabric to carry it. That is what makes this specifically a multi-node problem: a single-node job never touches the fabric and could not produce this failure at all.
Large training jobs run collective operations, AllReduce and All-to-All, where every GPU exchanges gradients with every other GPU in lockstep. The step cannot finish until the slowest exchange finishes. So the network between nodes is not plumbing; it is on the critical path.
The Dell-Broadcom AI Lab carries that traffic with RoCEv2 (RDMA over Converged Ethernet): one machine's Broadcom NIC writes directly into another machine's GPU memory with no CPU in the path, across the Dell PowerSwitch fabric. RDMA assumes the network never drops a packet: a single drop forces a slow retransmit that stalls the whole collective. Plain Ethernet makes no such promise, so the fabric leans on two mechanisms to stay lossless:
- ECN / DCQCN, the gentle throttle. A switch marks packets as a queue fills; the receiver tells the sender to slow down.
- PFC (Priority Flow Control), the hard brake. Just before a buffer overflows, a switch sends a pause upstream: stop, don't drop.
A healthy fabric mostly uses ECN and rarely needs PFC. Hold that thought.
Why This Is a "Gray Failure"
A component that looks healthy to its own monitoring while it degrades the real workload. The defining trait, differential observability, is a gap between what the system reports about itself and what the user actually experiences.
It fits exactly.
| The Fabric's Self-View | The Training Job's Reality |
|---|---|
| Links up, oper_status = 1 | Collective crawling |
| Zero packet drops | 4.5% of packets retransmitted |
| No alarms firing | Step time inflated |
| Bandwidth graph looks normal | GPUs idling, waiting |
Table 1 | Differential observability
Nothing pages anyone. The bandwidth chart even looks busy. The only evidence lives in control-plane counters, RNR on the NIC and PFC on the switch, that no standard dashboard plots.
Why Standard Monitoring Misses It
Most fabric monitoring is single-layer, either the switch or the host, and it watches throughput, link state, and errors. This failure trips none of those. To see it, you have to correlate two layers at once: the host side (RNR at the RDMA transport on the Broadcom NIC) and the switch side (PFC pauses on the exact Dell PowerSwitch ports those hosts use), and then confirm what isn't there, zero drops and zero physical errors, to rule out the look-alikes.
That correlation needs a piece most clusters don't have wired: a map from a host's NIC to the switch port it plugs into. Without it, you have two piles of numbers and no way to line them up. This is the gap the Dell-Broadcom AI Lab set out to close with autonomous agents.
02 · THE VALIDATION ENVIRONMENT
The Dell-Broadcom AI Lab provides a controlled environment for testing and validating AI infrastructure behavior before broader deployment. The environment combines Dell PowerEdge XE9680 servers with AMD Instinct and NVIDIA GPUs, Broadcom BCM57608 (Thor 2) RoCE NICs in the hosts, Dell PowerSwitch Z9864F-ON switches built on Broadcom Tomahawk 5 silicon and running Enterprise SONiC, Dell PowerScale storage, and Dell iDRAC on every server. The lab is intentionally heterogeneous, which makes it useful for validating how compute, networking, storage, and operations work together across realistic multi-node AI environments, rather than in a single-vendor or single-layer test. On top of that, the lab team runs something most AI clusters still do not have: a team of autonomous agents that read the switch, the NIC, and iDRAC together, root-cause faults across all three, and stage remediation for a human to approve. The agent platform is Metrum AI Ops. This field note walks through one fault those agents caught, explained, and recommended a fix, end to end.
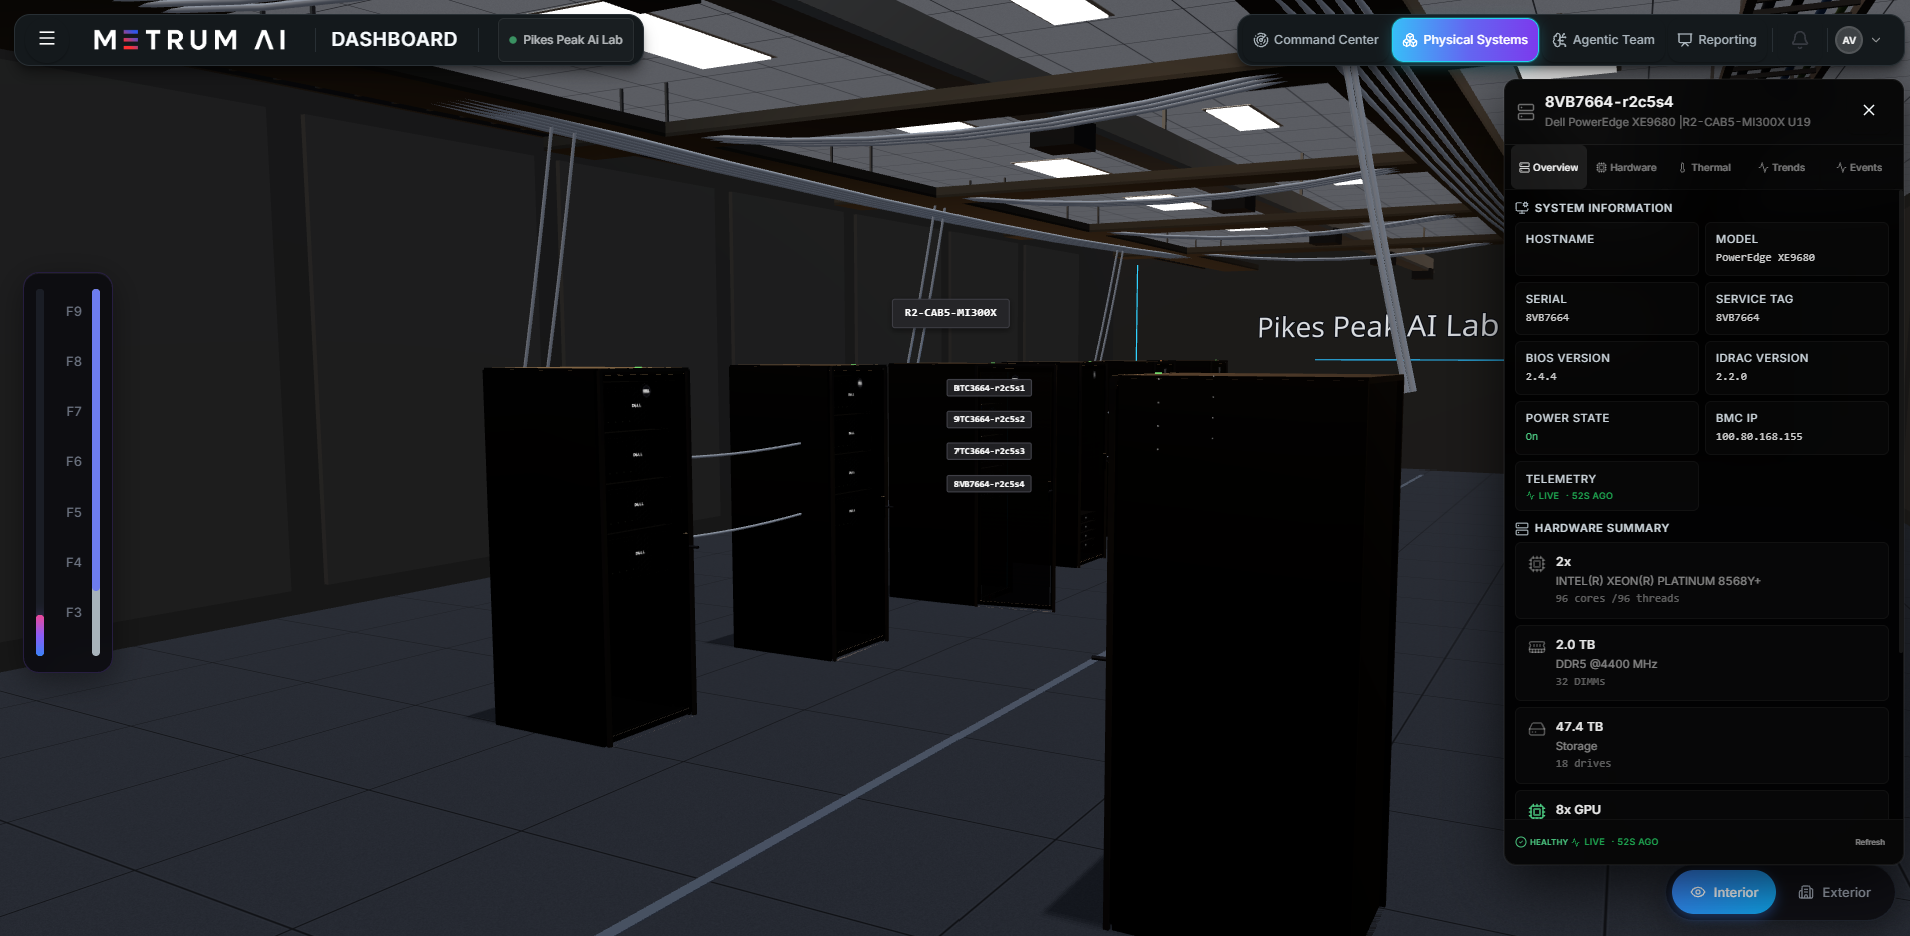
Figure 1 | Metrum AI Ops Digital Twin view showing Pikes Peak AI Lab
| Item | Detail |
|---|---|
| Facility | Dell-Broadcom AI Lab (Pikes Peak AI Lab) |
| Compute | 23 nodes, 166 GPUs: 12× Dell PowerEdge XE9680 (AMD Instinct MI300X, 96 GPU) · 8× XE9680 (NVIDIA H200, 64 GPU) · 2× PowerEdge R760xa (NVIDIA L40S) · 1× R760xa (ESXi, no GPU) |
| Storage | 4× Dell PowerScale F910 on OneFS, monitored via a OneFS exporter |
| Fabric | 3× Dell PowerSwitch Z9864F-ON (Broadcom Tomahawk 5, 64× 800GbE) on Enterprise SONiC 4.4.0, RoCEv2 · Broadcom BCM57608 (Thor 2) 2×200G RoCE NICs in the GPU hosts |
| Telemetry sources | 6: Dell iDRAC (Redfish), Dell PowerSwitch (SONiC), Broadcom RDMA NIC exporter, GPU/host agent, OneFS exporter, kernel & SSD |
| This incident | RoCE RX back-pressure · nodes r2c8s1 & r2c8s2 · same leaf switch (intra-leaf) |
Table 2 | Lab inventory
03 · WHAT THE AGENTS WATCH
Dell and Broadcom hardware already exposes the telemetry that explains a fault of this kind. iDRAC exposes the host. The Broadcom NIC exposes the RDMA transport. The Dell PowerSwitch running SONiC exposes the fabric. Metrum AI Ops supplies the layer that reads these sources together and reasons across them.
Table 3 separates platform coverage from the evidence this investigation actually used. An available integration is not proof that the source contributed to this diagnosis.
| Source | Signal | What It Contributed |
|---|---|---|
| Broadcom RDMA NIC exporter | RNR NAK retries, receive-side discards, congestion and traffic-class counters | Identified receiver-not-ready behavior on both affected hosts. Primary evidence. |
| Dell PowerSwitch (SONiC) | PFC pause counters, ECN, queue drops, interface counters | Showed host-originated PFC activity with zero reported queue drops on the connected interfaces. Primary evidence. |
| LLDP topology map | Host NIC to switch interface mapping | Placed both hosts on one leaf and identified which interfaces to read. Without it, the NIC and switch counters cannot be aligned. |
| Dell iDRAC (Redfish) | Host, power, thermal, storage-controller, and port-state signals | Ruled out a host hardware fault while testing alternatives. Supporting evidence, not part of the detection chain. |
| GPU and host telemetry | Utilization, memory, temperature, power, clocks, ECC | Integrated in the lab; applies to the GPU XID and ECC fault classes listed as next validation areas in Section 09. |
| Dell PowerScale (OneFS exporter) | Cluster, node, and storage-service health | Integrated in the lab; applies to the storage management-plane scenarios in Section 09. |
| Kernel and SSD telemetry | Device, controller, and media-health events | Integrated in the lab; applies to the SSD wear and NVMe controller instability scenarios in Section 09. |
Table 3 | Telemetry sources and their contribution. The grouping separates the evidence behind this diagnosis from integrations that were available but not exercised by this specific incident.
Agent Roles and the Approval Boundary
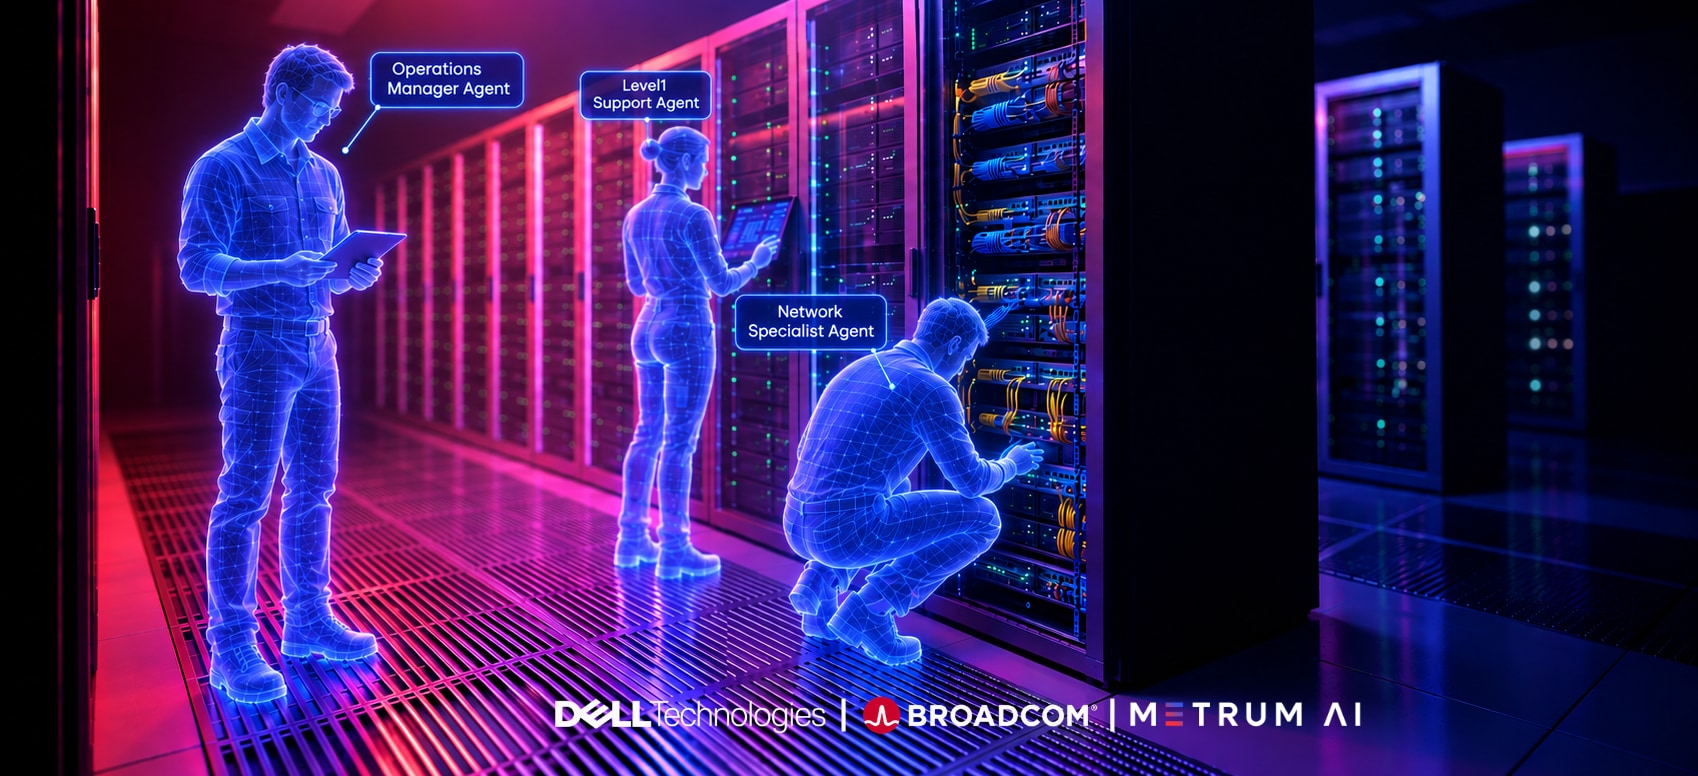
The workflow uses two analytical agents and a coordinator. A Level 1 agent detects the condition and localizes it. An Operations Manager routes the case. A network specialist agent correlates the cross-layer evidence, ranks candidate causes, and drafts the recommendation.
Telemetry collection runs read-only, and the staged output is a recommendation rather than an executable change. A member of the lab team must approve any configuration change before it reaches a device. Policy enforcement, automated rollback, and audit integration are requirements for closed-loop operation; this investigation did not exercise them, and this field note does not present them as demonstrated.
| Field | Detail |
|---|---|
| Ticket | INC0010398: Priority 2 · High · Network · State: New, awaiting approval |
| Level 1 Support (created) | RoCE RX back-pressure on r2c8s1, r2c8s2: detected, localized to leaf cos-ai-r2c8sw1, and routed for human approval within ~5 minutes of first detection. |
| Network specialist (work note) | Ranked root cause attached, with evidence and the tiered remediation from Section 6. Awaiting approval from the Dell-Broadcom AI Lab team before any change is applied. |
Table 4 | INC0010398: state at the time of writing
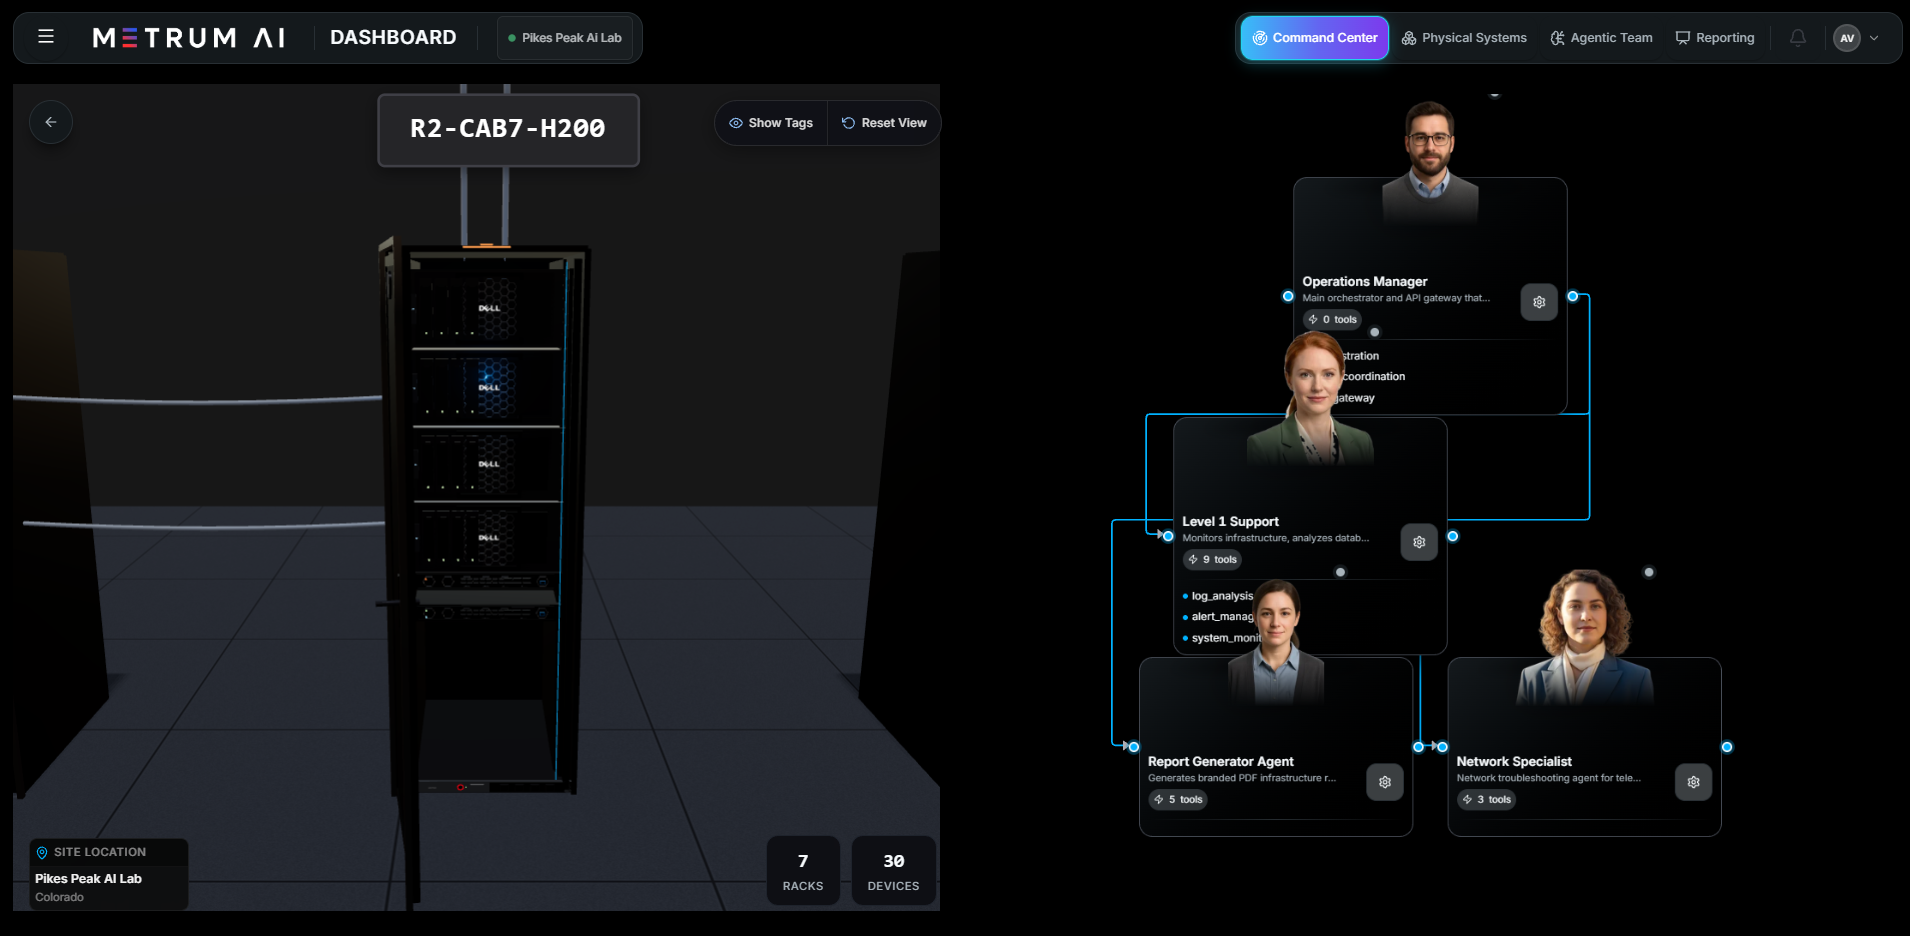
Figure 2 | Metrum AI Ops Command Center showing rack view and multi-agent team view
04 · THE INCIDENT AND EVIDENCE CHAIN
A Receiver That Couldn't Keep Up
On r2c8s1 and r2c8s2, the Broadcom NIC telemetry showed a counter almost nobody watches: RNR NAK retries. RNR stands for Receiver Not Ready, the RDMA receiver telling the sender "I have no buffer for this yet, resend later." The sender waits out a timer and retransmits. A handful of RNRs is normal.
These two nodes had logged millions: approximately 7.3 million RNR NAK retries, indicating repeated receiver-not-ready conditions, with approximately 4.48% of packets associated with receiver-not-ready retransmission in the captured data.
| Signal | Value |
|---|---|
| RNR NAK retries: one side sending faster than the other could receive | 7.3M |
| Share of all packets resent because the receiver wasn't ready, roughly 1 in 22 | 4.48% |
Table 5 | Receiver back-pressure signature
The corresponding Dell PowerSwitch ports recorded substantial PFC activity from the hosts, while queue drops and physical-layer errors remained at zero. Put together, the picture is a slow receiver, one side outrunning the other's ability to take data in. Not a broken cable, not a congested core: an endpoint that could not drain its own NIC fast enough.
The Detection, Shown
With that instrumentation already in place, three of its read-only sources, the Broadcom NIC RDMA exporter, the Dell PowerSwitch (SONiC) telemetry, and the LLDP topology map, turn the detection into a correlation that all three have to agree on. For r2c8s1 and r2c8s2, both on the same leaf switch:
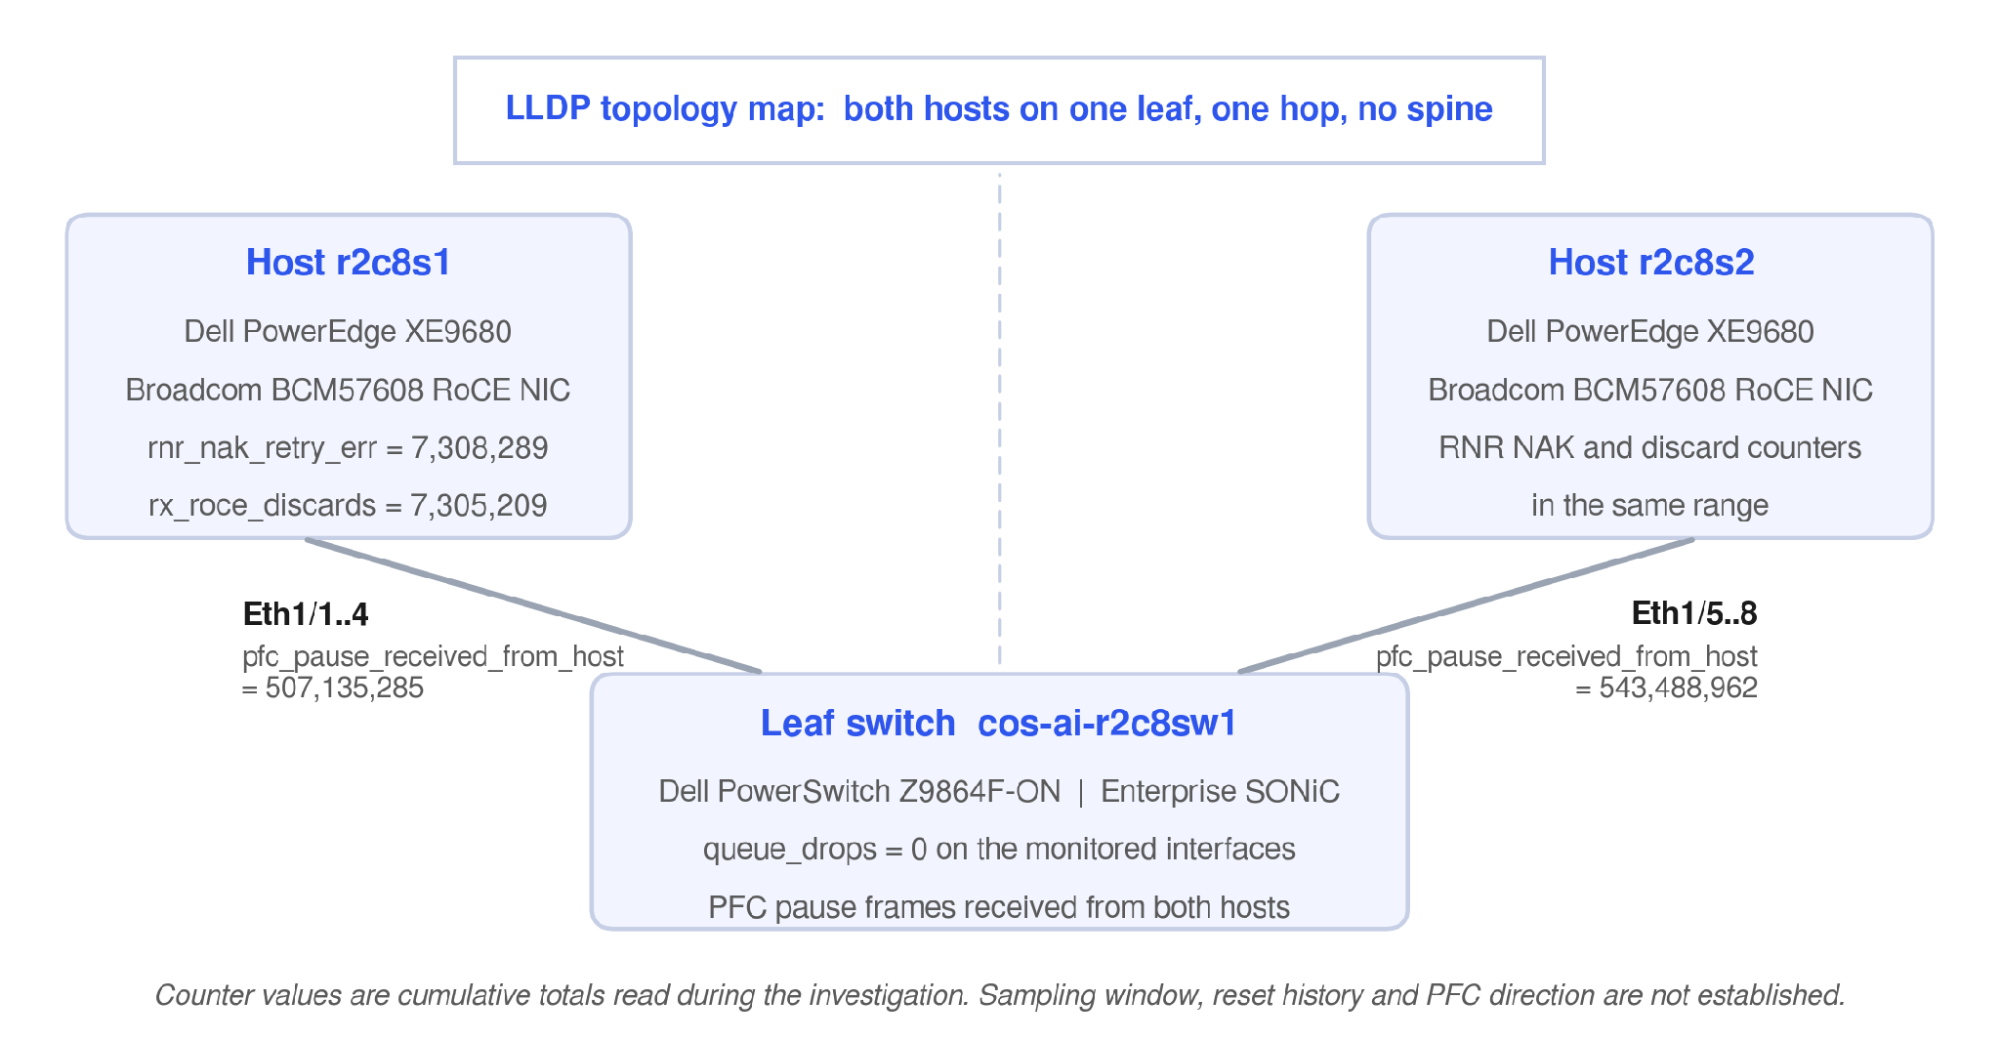
Figure 3 | Two hosts, one leaf switch. The correlation the agents assembled from NIC telemetry, switch telemetry, and the LLDP topology map. Alt text: a diagram mapping hosts r2c8s1 and r2c8s2 through interfaces Eth1/1..4 and Eth1/5..8 to leaf switch cos-ai-r2c8sw1, annotated with the RNR, discard, PFC, and queue-drop counters read during the investigation.
Three layers, one story: a receiver back-pressure event, intra-leaf (one hop, no spine), with zero packet loss. PFC held the line, but at the cost of constant pausing.
The agents used the LLDP topology map to connect the two hosts to the same leaf switch and then correlated the NIC and switch evidence. The resulting diagnosis was a receiver-side back-pressure condition: the receiver could not drain incoming traffic at the rate offered by the sender.
The wording above intentionally distinguishes evidence from inference. The counters demonstrate receiver-not-ready behavior and PFC response; they support, but do not by themselves prove, the precise application-level mechanism that caused the receiver to fall behind.
05 · RULING OUT LOOK-ALIKES
The same PFC symptom shows up in problems with very different causes, so the differential matters. This is where having the switch, the NIC, and iDRAC in one pipeline pays off, because each look-alike is cleared by a different source:
- Not packet loss: switch queue drops on the Dell PowerSwitch were zero.
- Not a bad cable or optic: symbol and link-integrity errors on the NIC and switch ports were zero; the physical layer was clean.
- Not a fabric-wide PFC storm: the pauses stayed at the host-to-leaf edge, never propagated to the spine, and the storm watchdog never tripped.
Not a host hardware fault either: iDRAC on both PowerEdge nodes is the source the agents check for thermal, power, and NIC port events, and it gave no reason to suspect the server itself. What's left is the receiver: too few receive buffers posted, or a NIC the GPU couldn't drain fast enough.
This differential diagnosis is the core proof point. The system did not merely report that "the network was slow"; it identified what the event was not, localized where it was occurring, and ranked the remaining cause.
06 · THE GOVERNED REMEDIATION
The Industry Check
This isn't a niche curiosity. In "RDMA over Ethernet for Distributed AI Training at Meta Scale" (SIGCOMM 2024), Meta describes the same failure modes from running one of the world's largest AI networks: receiver-side bottlenecks, the burstiness of collectives, and load imbalance across paths. The most useful part corrected the lab team's own first instinct about the fix: after finding DCQCN tuning impractical to get right at their scale, Meta's team moved congestion management out of the network layer entirely and into the collective communication library itself, letting the receiver, not a switch knob, decide when the sender is allowed to transmit.
The immediate relief options include reviewing receive-buffer depth, RNR retry behavior, and compute/communication overlap. These are tactical mitigations and should be tested against the workload and software stack.
Meta found the same. Their solution was receiver-driven traffic admission: the sender may only transmit after the receiver grants a clear-to-send. If the sender can never outrun the receiver, the receiver is never "not ready," and RNR cannot happen. It fixes the cause at the collective layer, not with a driver knob.
The lab's higher-level recommendation is to evaluate receiver-driven admission or clear-to-send behavior in the collective communication layer, co-tuned with the Ethernet fabric. That recommendation is staged for human approval; it was not applied as part of this investigation.
So the network specialist agent's recommendation, attached to INC0010398, splits into tiers:
| Tier | Status | Action |
|---|---|---|
| Strategic: the root fix | Recommended, staged for human approval | Enable receiver-driven / clear-to-send admission in the collective library (NCCL/RCCL), co-tuned with the Dell PowerSwitch fabric. The approach Meta actually deployed. |
| Tactical: relief | Recommended | Increase receive-buffer depth, review the RNR retry timer, and check receiver-side compute/communication overlap. |
Table 6 | Remediation tiers
07 · WHAT CHANGED OPERATIONALLY
Two operational numbers tell the story. MTTD, mean time to detect, is how long a fault runs before anyone notices. MTTK, mean time to know, is how long from noticing to understanding the root cause. On the lab the two map cleanly onto two agents: Level 1 detects and localizes, then the network specialist root-causes the cross-layer correlation. For a gray failure, both numbers are the whole battle.
The agents detected, localized, and produced a ranked root-cause recommendation for the incident in approximately five minutes. The ~5 minute figure covers the detection and root-cause workflow, including human-approval routing; it does not represent remediation completion or total incident-resolution time. And on the standard-monitoring side, no actionable alert was generated for this condition. The honest way to state the operational improvement is: from no actionable alert in the existing dashboards, to cross-layer diagnosis and a governed next action in approximately five minutes.
| Metric | With the Agents | Evidence Basis |
|---|---|---|
| MTTD (detect · L1) | ~45-90 s: detector ~1 s + KB retrieval ~12 s, then L1 reasoning ~30-75 s to localize and hand off | Measured |
| MTTK (root-cause · network specialist) | +~30-90 s: the specialist correlates Broadcom NIC + Dell PowerSwitch counters, ranks the root cause, and writes the analysis | Measured |
| End-to-end | ~5 min observed: a ~60 s scrape floor plus LLM reasoning across both agents | Measured |
Table 7 | MTTD / MTTK with the Metrum AI Ops agents
The deterministic core is tiny: the detector runs in about a second and the knowledge-base lookup adds ~12 s, both measured. The rest of the ~5 minutes is LLM reasoning spread across the two agents, roughly half in L1's detection and localization, half in the specialist's root-cause analysis. The point isn't just a faster alarm: a gray failure has no alarm to speed up, so this is the difference between "never caught" and "caught, localized, and explained in minutes."
These numbers don't tell us how long this particular event ran before the RDMA exporter came online on the lab, and we won't manufacture a false-precision cost estimate for a duration we don't actually know. What they do tell us is what happens to the next one.
Turning "never caught" into "caught, localized, and explained in about five minutes" is the difference that compounds every time this pattern recurs across a fleet this size, not just once.
08 · WHY THIS MATTERS FOR DELL AI FACTORY CUSTOMERS
The lab demonstrates that Dell and Broadcom infrastructure can expose the evidence needed to explain difficult AI-fabric failures when telemetry is connected across the stack.
For customers, the implication is broader than one RoCE runbook:
- Validate before scale: use a lab to test compute, network, storage, and operations together.
- Operate the full stack: correlate infrastructure health with workload behavior.
- Protect GPU utilization: identify gray failures before they become prolonged training or inference delays.
- Use an open ecosystem: combine Dell infrastructure, Broadcom Ethernet, AMD and NVIDIA accelerators, Enterprise SONiC, and partner software.
- Govern change: stage remediation with policy, approval, rollback, and audit controls.
This is the Dell AI Factory story in operational form: a validated foundation, an open partner ecosystem, and expert services that help move AI infrastructure from deployment to dependable production operation.
09 · SCOPE, MATURITY AND NEXT PHASE
This case documents one lab investigation. It is not a product announcement, benchmark, guarantee, or claim that the same diagnosis will occur in every environment. Coverage maturity varies by runbook. The demonstrated capability is cross-layer detection, localization, root-cause reasoning, and staged remediation. Approved and applied closed-loop remediation remains a controlled next phase.
The next validation areas include ECN hotspots, PFC storms, link flaps, GPU XID and ECC faults, SSD wear, NVMe-controller instability, and storage-management-plane health. Each scenario should preserve the same evidence discipline: identify the measured signal, distinguish inference from proof, document the approval boundary, and publish only validated outcomes.
Metrum AI Ops is the platform behind the agents on the Dell-Broadcom AI Lab: compute, storage, and fabric in one detection pipeline, one agent team, with a human approving every change.
Source and positioning references
| 1. | Gangidi et al., RDMA over Ethernet for Distributed Training at Meta Scale. ACM SIGCOMM 2024, with the companion Engineering at Meta article of 5 August 2024. |
| 2. | NVIDIA, RDMA-Aware Networks Programming User Manual. Glossary entries for RNR and Receive Request. |
| 3. | NVIDIA, NCCL User Guide, Collective Operations. |
| 4. | Mittal et al., Revisiting Network Support for RDMA. ACM SIGCOMM 2018. |
| 5. | The Dell AI Factory with NVIDIA |
| 6. | Dell AI Factory FY27 partner ecosystem positioning |
| 7. | Dell AI Factory FY27 H2 campaign narrative |
Disclaimer
This document is provided for informational purposes only. It describes a field investigation conducted on the Dell-Broadcom AI Lab, a Dell Technologies and Broadcom facility, using the Metrum AI Ops platform. It is not a product announcement, benchmark, or guarantee of performance, availability, or outcomes in other environments. The remediation described as staged for approval had not been applied at the time of writing; the MTTD/MTTK figures reflect the detection and root-cause workflow only, not incident resolution. Actual results will vary based on workload, configuration, deployment conditions, and other factors.
Autonomous remediation requires customer-defined policy, approval gates, rollback procedures, credential controls, and change-management integration. Production deployments must be evaluated against each organization's safety, security, and compliance requirements.
Dell, PowerEdge, PowerScale, PowerSwitch, and iDRAC are trademarks of Dell Inc. or its subsidiaries. Broadcom and Tomahawk are trademarks of Broadcom Inc. SONiC is a project of the Linux Foundation. NVIDIA and H200 are trademarks of NVIDIA Corporation. AMD and Instinct are trademarks of Advanced Micro Devices, Inc. All other trademarks are the property of their respective owners. Use of these names does not imply endorsement.
Third-party statistics and projections cited herein are attributed to their respective sources and have not been independently verified by Dell Technologies, Broadcom, or Metrum AI.