Disaggregated prefill and decode across two Dell™ PowerEdge™ XE9680 nodes with AMD Instinct™ MI300X GPUs, Broadcom® BCM57608 400 GbE NICs, and a Dell PowerSwitch® Z9864F-ON.
On two Dell PowerEdge XE9680 servers with Broadcom BCM57608 400 GbE NICs and a Dell PowerSwitch Z9864F-ON, moving the KV cache over RoCE cut the median time to first token at 64 concurrent coding agents from 78.6 s over TCP to 1.09 s on the same ports. The switch dropped no packets. At 128 agents, the median was 3.27 s against 170 s, and RoCE processed 447,416 input tokens per second against 12,190 for TCP.
Executive summary
Coding agents resend their full conversation on every turn. The model server keeps the key-value (KV) cache of that conversation, so each turn computes only the new tokens. Disaggregated serving splits inference into a prefill stage, which reads the prompt, and a decode stage, which writes the reply, and runs each stage on its own machines. The KV cache then crosses the network on every request.
This paper measures the network demand of that transfer on two Dell PowerEdge XE9680 nodes. Each node had eight AMD Instinct MI300X GPUs and eight Broadcom BCM57608 400 GbE NICs, and one Dell PowerSwitch Z9864F-ON connected the nodes. The nodes served MiniMax-M2.7 [6] with vLLM [3] and replayed coding-agent sessions [4] from SWE-bench [5]. Each request moved 3.8 to 6.3 GB of KV cache from the prefill node to the decode node. The KV cache moved over RoCE and over TCP on the same eight 400 GbE ports per node at 11 levels from 1 to 784 concurrent sessions.
At 64 concurrent agents, the median time to first token was 1.09 s over RoCE and 78.6 s over TCP. At 128 agents, it was 3.27 s over RoCE and 170 s over TCP. At 128 agents, RoCE processed 447,416 input tokens per second against 12,190 over TCP, 36.7 times the input throughput versus TCP. Input tokens per second counts every prompt token served, including tokens found in the prefix cache. RoCE completed 19.4 requests per second against 0.58, and each request moved 5.8 GB of KV cache over RoCE and 5.3 GB over TCP.
RoCE is RDMA over Converged Ethernet. It requires an exact fabric configuration: RoCE traffic marked with DSCP 26 and mapped to traffic class 3, with priority flow control (PFC) and explicit congestion notification (ECN) enabled. Separate fabric tests read the switch and NIC counters to validate that configuration. When one node sent RoCE traffic without the DSCP 26 marking, a 2:1 incast reached 18.7 Gb/s with 18,165,289 dropped packets. With the marking applied, the same test reached 392.2 Gb/s with no drops.
Results at a glance
Time to first token Median at 64 sessions: 1.09 s on RoCE, 78.6 s on TCP. At 128 sessions: 3.27 s and 170 s. | Input throughput At 128 sessions: 447,416 input tokens per second on RoCE, 12,190 on TCP. |
Completed requests At 128 sessions: 19.4 per second on RoCE, 0.58 on TCP. Each request moved 5.8 GB of KV cache over RoCE and 5.3 GB over TCP. | KV handoff Mean per request at 128 sessions: 77 ms on RoCE against a 30 ms floor on 4 rails, and 140 s on TCP. |
Port headroom At 128 sessions, KV traffic averaged 929 Gb/s on one node's eight ports, 29% of their 3,200 Gb/s line rate. The switch counters recorded no dropped packets on any of the 16 ports. | Energy (GPU only) At 128 sessions, RoCE produced 0.1736 output tokens per GPU joule and TCP 0.0186, 9.3 times as many. |
KV cache in coding-agent inference
The KV cache holds the key and value vectors that a transformer computes for every input token at every layer. It grows with context length, and the model fixes its size per token.
For MiniMax-M2.7, each token needs 62 layers x 8 KV heads x 128 dimensions x 2 (key and value) x 2 bytes, which is 253,952 bytes, or 248 KiB. The 2 bytes per value come from the BF16 KV cache.
An agent loop reads the history, calls a tool, appends the tool output, and queries the model again. Each call therefore repeats the whole history and adds a small amount at the end. At 128 sessions over RoCE, a request carried 22,877 prompt tokens on average, and the model wrote up to 128 tokens back.
The workload drew on a public dataset of 787 coding-agent sessions (see References), 669 of them from SWE-bench tasks. The runs in this paper replayed 320 of those sessions, all from SWE-bench. Each simulated user replayed a slice of up to 10 turns of one session and sent the next turn as soon as the previous reply ended, with no think time. Every user therefore kept one request in flight, which made the load a closed-loop stress test.
Disaggregated prefill and decode
Compute limits prefill, and memory bandwidth limits decode. On shared GPUs, a long prefill delays the decode steps of every other session. Separate GPU pools let each stage scale on its own [1].
Disaggregation adds one KV transfer per request. The decode engine needs the cache that the prefill engine built in its own GPU memory before it can write the first token. The cache therefore crosses the network between the two nodes. Figure 1 shows the tested layout.
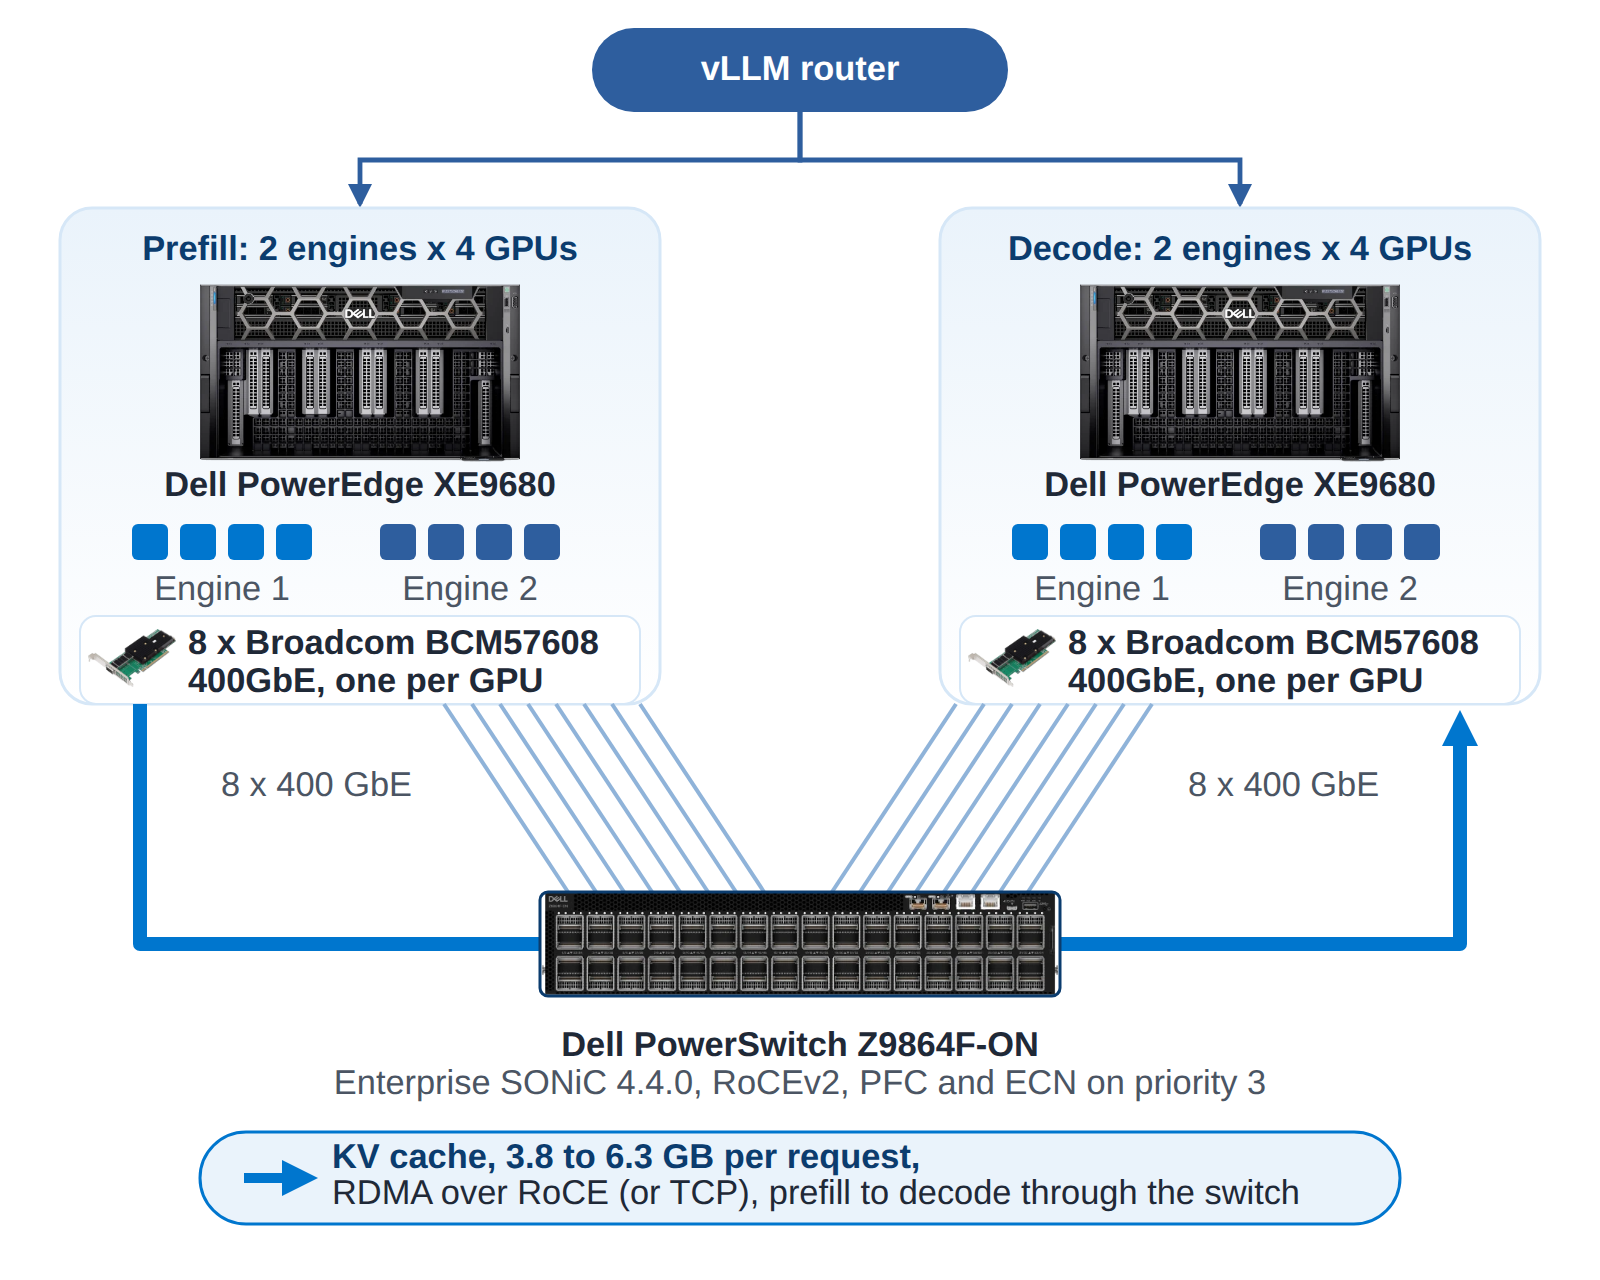
Figure 1 | The prefill node built the KV cache and sent it to the decode node. Each GPU worker used its own 400 GbE rail.
KV cache size by context length
Context length (tokens) | KV cache size (GB, 10⁹ bytes) | One 400 GbE rail at 392 Gb/s |
8,192 | 2.08 | 42 ms |
21,000 | 5.33 | 109 ms |
32,768 | 8.32 | 170 ms |
65,536 | 16.64 | 340 ms |
131,072 | 33.29 | 679 ms |
Table 1 | KV cache size of MiniMax-M2.7 (BF16) by context length, and the time to move it over one 400 GbE rail at the measured 392 Gb/s. Sizes follow from 253,952 bytes per token.
Across both transports, each request moved 3.8 to 6.3 GB of KV cache (Table 8). At 5.8 GB, one 400 GbE rail at the measured 392 Gb/s needs about 118 ms. A prefill engine spanned 4 GPUs and therefore 4 rails, so a RoCE handoff needs at least 30 ms.
RoCE fabric requirements
RDMA lets a NIC write directly into the memory of another machine, including GPU memory, without the kernel network stack or a CPU copy. RoCE version 2 [9] carries RDMA over UDP and IP on Ethernet and assumes a network that almost never drops a packet. A lost packet makes the NIC resend the stream from that packet onward and lower its sending rate through congestion control [7].
KV transfers produce incast: many GPU workers on the prefill node write to the decode node at the same time, so several senders target one receiving port. The RoCE traffic class must absorb this without loss. Figure 2 shows the three mechanisms that keep that class lossless, including PFC [8], and Table 2 lists the values used.
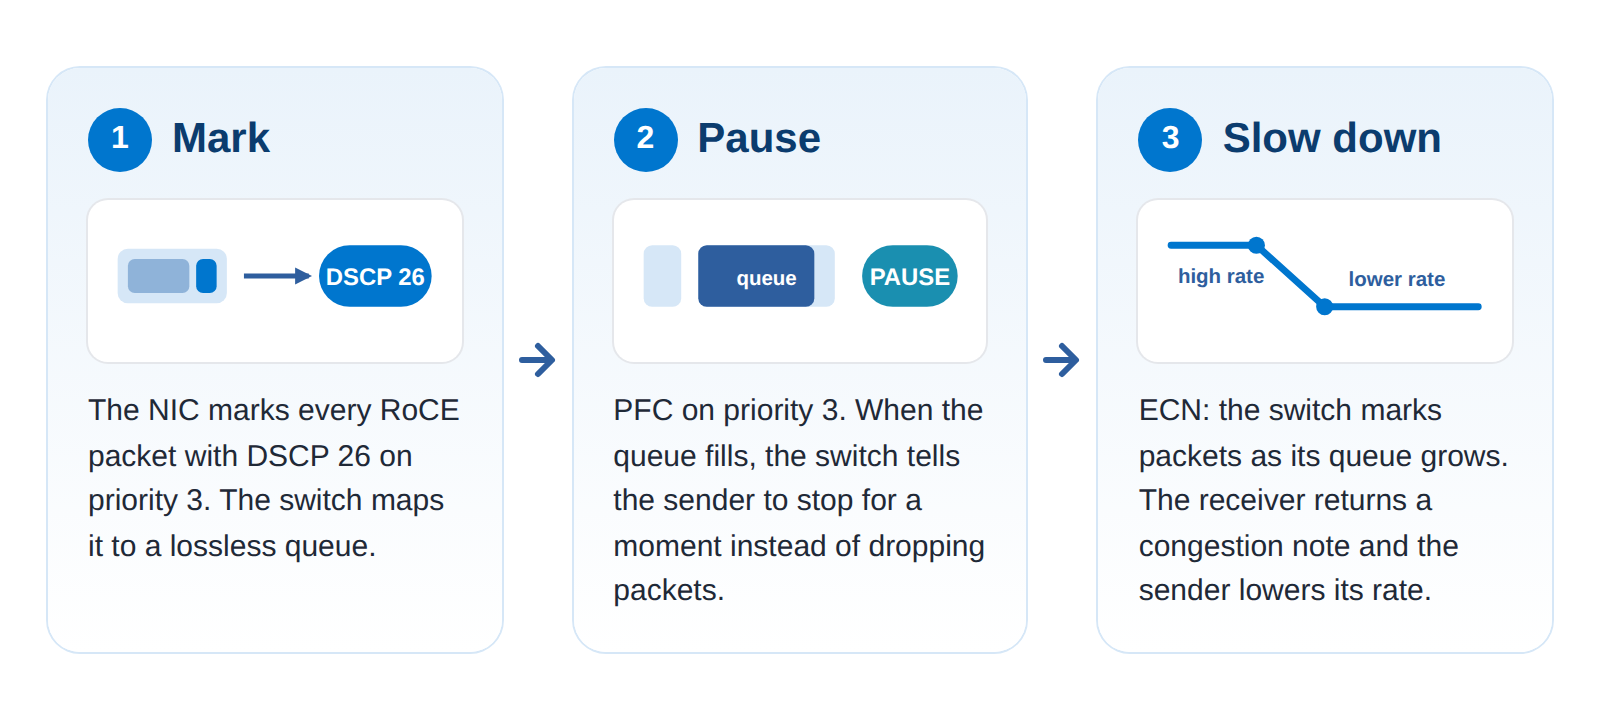
Figure 2 | The NIC marks RoCE traffic, the switch gives it a protected queue and pauses senders before the queue overflows, and ECN tells senders to slow down earlier.
RoCE settings on the NICs and the switch
Setting | On each NIC (8 per node) | On the switch |
RoCE marking | RoCE v2, GID index 3, DSCP 26 on priority 3; DSCP 26 mapped to priority 3 (AF31) | DSCP 26 to traffic class 3, queue 3, priority group 3 |
Priority flow control | Enabled on priority 3 only | Enabled on priority 3, and on priority 4, the SONiC default lossless class |
ECN and congestion notification | Congestion control on; congestion notification packets use DSCP 48 on priority 7 | ECN marking from 500 KB to 1,500 KB of queue, 20% mark probability; DSCP 48 to traffic class 6 |
Frame size and link | MTU 9000; 400 GbE, RS FEC, PCIe Gen5 x16 | MTU 9100; 2 m direct-attach copper cables |
Table 2 | RoCE settings on each NIC and on the switch.
A mismatch on either side leaves the traffic unprotected. A NIC that marks packets with another DSCP value places them in a switch queue that is not lossless. A NIC with PFC off ignores the pause frames that the switch sends. In both cases the cluster keeps running and the network drops packets under load (see Fabric results). UCX [10], the communication library under NIXL, can carry a transfer over TCP when the RDMA path is unavailable. A broken RDMA path therefore appears as slower requests rather than an error [2]. The RoCE runs in this paper limited UCX to RDMA transports, so no transfer fell back to TCP.
Test platform
Dell PowerEdge XE9680 with Broadcom BCM57608 NICs
The Dell PowerEdge XE9680 is Dell's 6U server for AI training and inference. The tested configuration had eight AMD Instinct MI300X accelerators joined by AMD Infinity Fabric, with 1.5 TB of HBM3 per server. It had one Broadcom 400 GbE NIC per GPU, so every GPU worker had its own network rail. MiniMax-M2.7 fits on four of the eight GPUs, so each node ran two engines. The large GPU memory leaves room for up to 3.6 million tokens of KV cache per node at default settings. The RoCE runs used 2.0 million, for the reason in Table 4.
The network ran on Broadcom silicon from end to end. Each rail was a Broadcom BCM57608 (Thor™ 2) 400 GbE NIC on PCIe Gen5 x16, with RoCE v2 and hardware congestion control.
Dell PowerSwitch Z9864F-ON with Broadcom Tomahawk 5
All 16 rails of the two nodes met in one Dell PowerSwitch Z9864F-ON. This 2U switch has 64 ports of 800 GbE, is built on the Broadcom Tomahawk™ 5 switch chip, and runs Dell Enterprise SONiC. DSCP marking, PFC, and ECN on the NICs and the switch gave the KV traffic a lossless class (Table 2). Table 3 lists the platform components.
Platform components
Component | Specifications | In this test |
Dell PowerEdge XE9680 | 6U server with eight AMD Instinct MI300X OAM accelerators joined by AMD Infinity Fabric; 1.5 TB of HBM3 per server | 2 nodes, each with 2 Intel Xeon Platinum 8568Y+ CPUs: one prefill node and one decode node, each running 2 engines of 4 GPUs |
AMD Instinct MI300X | CDNA 3 architecture; 192 GB of HBM3 at 5.3 TB/s peak bandwidth; 304 compute units; 750 W | 16 GPUs, tensor parallel 4 per engine; MiniMax-M2.7 in FP8 with a BF16 KV cache |
Broadcom BCM57608 (Thor 2) | 400 GbE Ethernet NIC on PCIe Gen5 x16; RoCE v2 with hardware congestion control | 8 per node, one per GPU; driver 1.10.3, firmware 235.1.157.0 |
Dell PowerSwitch Z9864F-ON | 2U switch with 64 ports of 800 GbE (OSFP112) on the Broadcom Tomahawk 5 switch chip; Dell Enterprise SONiC | 16 ports at 400 GbE, one per rail; Enterprise SONiC 4.4.0 with PFC and ECN on priority 3 |
Table 3 | The platform. Specifications come from the Dell, AMD, and Broadcom data sheets [11] to [14]; the last column is how this test used each part.
Test configuration
Test configuration
Item | Value |
Nodes | Two Dell PowerEdge XE9680 nodes, each with 8 AMD Instinct MI300X GPUs (192 GB each) and 2 Intel Xeon Platinum 8568Y+ CPUs; BIOS 2.4.4; Ubuntu 24.04, kernel 6.8 |
Network | 8 Broadcom BCM57608 (Thor 2) 400 GbE NICs per node, driver 1.10.3, firmware 235.1.157.0, one NIC per GPU; one Dell PowerSwitch Z9864F-ON (Broadcom Tomahawk 5) on Dell Enterprise SONiC 4.4.0 |
Serving stack | vLLM 0.32.0 on ROCm 7.2.3 with the NIXL 1.4.0 connector over UCX; one prefill node and one decode node, each with 2 engines of 4 GPUs (tensor parallel 4); a vLLM router spread requests across the engines |
Engine settings, both runs | GPU memory utilization 0.90, maximum context 131,072 tokens, 16,384 batched tokens; prefix cache on the prefill engines and off on the decode engines; fresh engines for every run |
Model | MiniMax-M2.7, official FP8 weights, BF16 KV cache |
Workload | Coding-agent sessions from SWE-bench, replayed turn by turn; closed loop, no think time, output capped at 128 tokens; RoCE and TCP at 1, 2, 4, 8, 16, 32, 64, 128, 256, 512, and 784 concurrent sessions |
RoCE run | KV transfers over RDMA on all eight rails of each node, with GPU-direct RDMA. The engines capped KV memory at 59 GiB per GPU, 1,995,648 tokens per node, half the free GPU memory, because of a current ROCm driver limit on GPU memory pinned for RDMA. |
TCP run | KV transfer over TCP on the same eight 400 GbE ports, one per GPU worker; the 1 GbE management port carried no KV traffic. The engines used vLLM's default KV sizing, 3,638,304 tokens per node. TCP used UCX's default TCP transport settings, with zero-copy puts turned off because they are not usable with the UCX build that ships with NIXL 1.4.0. |
Measurement | Percentiles and averages over every request in each level's load window. Input tokens per second counts every prompt token served, including tokens whose KV cache the prefill engines already held (hit rate in Table 8). That cached KV still crossed the network. KV traffic came from the NIC byte counters, sampled every 5.5 s, and drops came from the switch port counters. |
Table 4 | Test configuration. The RoCE and TCP runs shared the model, dataset, layout, and request order. They differed in the KV transport and in the KV memory setting.
Terms. A session is one simulated agent. Time to first token (TTFT) is the wait from sending a request to receiving its first output token. P50 is the median and P99 is the 99th percentile. A load window runs from the first request sent after warm-up until the last request completes, so it includes the time that requests in flight take to drain. Incast is several senders writing to one port at once.
Fabric results
RDMA write tests between three XE9680 nodes validated the fabric before the inference runs. The bandwidth tests ran for 15 s with 1 MiB writes marked DSCP 26 over 4 queue pairs and read the switch and NIC counters before and after. The tests covered two node pairs, Node A with Node B and Node B with Node C. In the inference runs, Node B ran the prefill engines and Node C ran the decode engines.
Fabric validation results
Test (RDMA writes) | Result | Switch drops and NIC retransmits |
Eight rails at once, one direction | 3,134 and 3,135 Gb/s | none |
Full duplex, 16 one-way flows | 6,189 Gb/s | none |
4 KiB write latency, 8 rails | 5.23 to 5.35 µs typical, P99 5.50 to 5.94 µs | none |
2:1 incast, correctly configured | 392.2 and 392.0 Gb/s (two nodes) | none |
4:1 incast, correctly configured | 389.9 Gb/s | none |
Table 5 | Fabric validation on correctly configured nodes. Line rate is 400 Gb/s per rail.
Each of the eight correctly configured rails ran at line rate and carried about 392 Gb/s, 98% of the 400 Gb/s line rate. All eight rails together carried 3.13 Tb/s in one direction, and the node pair carried 6,189 Gb/s with traffic in both directions. Latency stayed at about 5.3 µs. During the incast tests, the switch and the receiving NIC slowed the senders as designed. In the 2:1 test, the switch marked 3,936,674 packets with ECN, and the receiving NIC sent 3,288 pause frames. In the 4:1 test, the receiving NIC sent 10,420 pause frames, and the switch paused the senders 10,692 times. Both tests ran with zero dropped packets and zero retransmissions.
Table 6 lists the as-found results of two nodes that were misconfigured at their first test. The NICs on Node A sent RoCE traffic with DSCP 0 instead of DSCP 26 because their quality-of-service profile was missing. The switch therefore placed that traffic in its lossy queue. PFC was off on every priority on Node C.
Incast results, as found and configured
Case | Throughput (Gb/s) | Switch drops | NIC RoCE discards | Out-of-sequence packets |
2:1 incast, RoCE outside the lossless class | 18.7 | 18,165,289 | not recorded | not recorded |
2:1 incast, correctly configured | 392.2 | 0 | 0 | 0 |
4:1 incast, PFC off on the sender | 391.5 | 94,422 | 82,703 | 112 |
4:1 incast, correctly configured | 389.9 | 0 | 0 | 0 |
Table 6 | Incast results as found and after configuration. The first two rows used Node A as the sender; the last two used Node C.
With DSCP 0 marking, two senders into one port reached 18.7 Gb/s against 392.2 Gb/s with the profile applied, a 21x gap. The switch dropped 18,165,289 packets in queue 0 and carried none in queue 3. With PFC off on the sender, aggregate throughput held at 391.5 Gb/s in a 15 s test, but the switch dropped 94,422 packets at the sender ports (0.05% of the packets the receiving queue carried). The receiving NIC discarded 82,703 RoCE packets, and the NICs counted 112 out-of-sequence packets. Each out-of-sequence packet forces a retransmission. With the profile applied, the same test dropped nothing. Neither failure stopped the test or returned an error to the application.
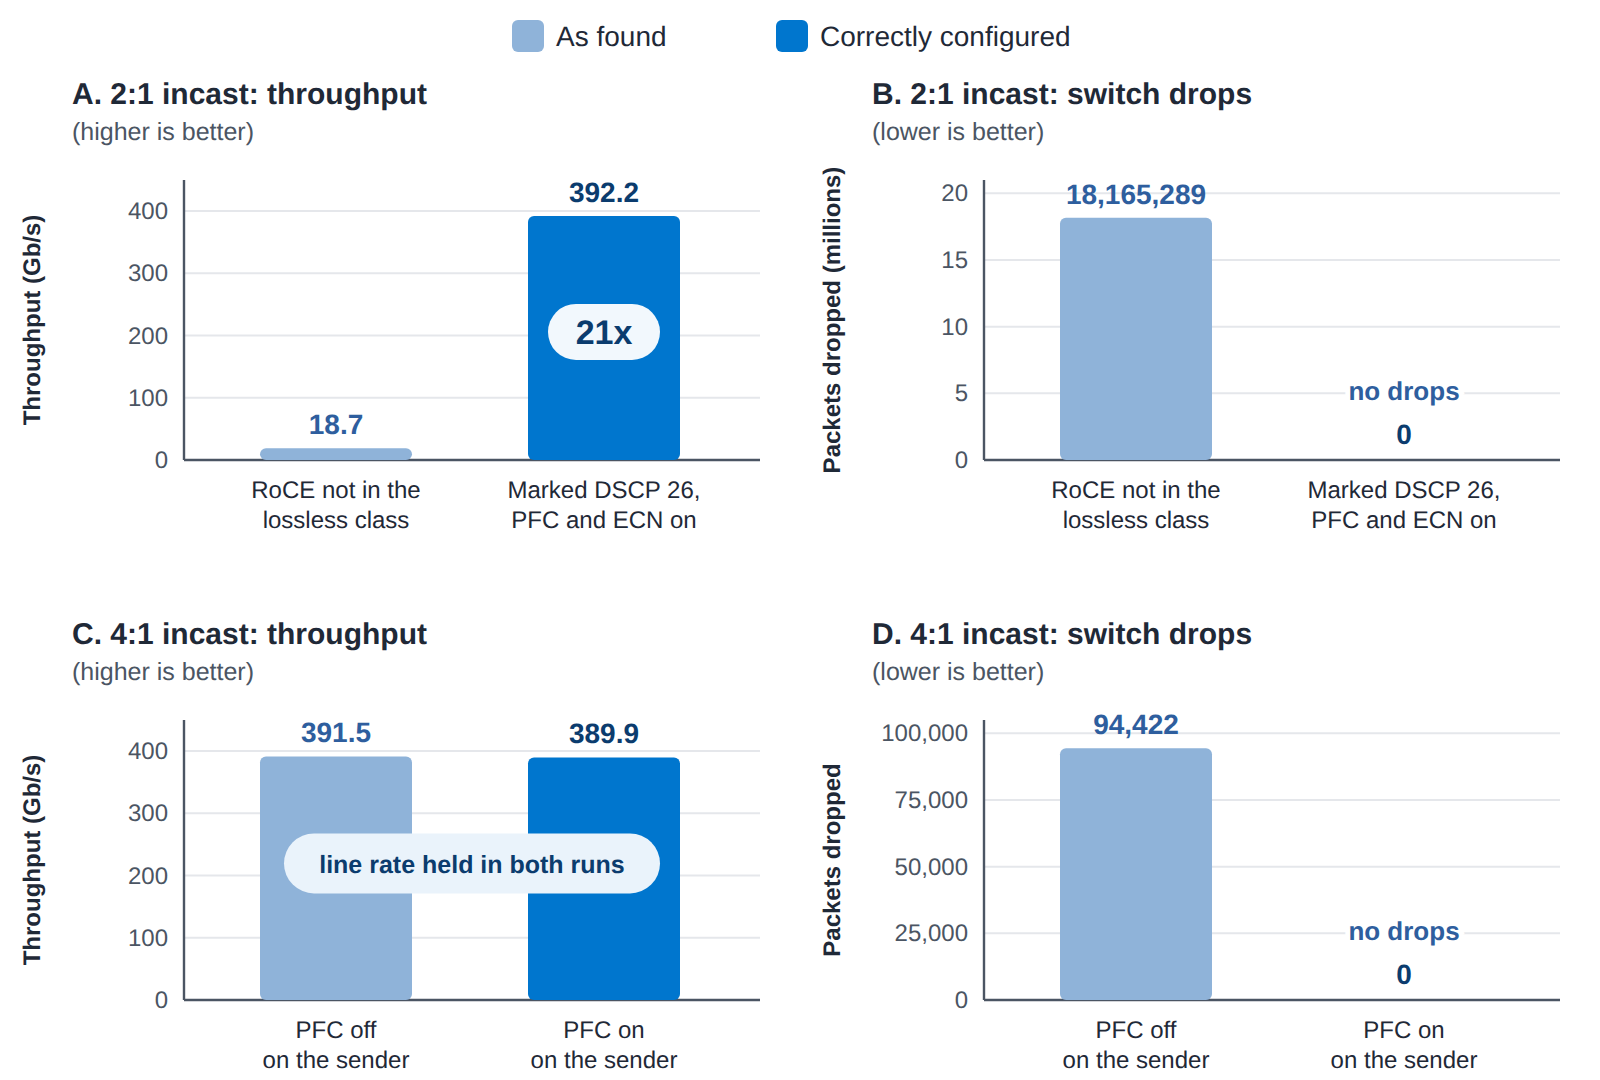
Figure 3 | As found, unmarked RoCE reached 18.7 Gb/s with 18,165,289 drops in a 2:1 incast, and a sender with PFC off lost 94,422 packets in a 4:1 incast.
Inference results: RoCE and TCP
From 1 through 128 sessions, RoCE rose from 19,003 to 447,416 input tokens per second, while TCP did not scale with load. TCP reached 11,431 at 8 sessions and stayed between 9,903 and 13,560 from 8 to 784 sessions. The RoCE lead was 3.7x at 1 session and 3.6x at 2, then grew to 5.4x at 4, 10.1x at 8, 12.8x at 16, 15.6x at 32, 32.2x at 64, and 36.7x at 128. At 256 sessions, RoCE fell to 107,304 input tokens per second, still 10.8x TCP. Its prefix-cache hit rate fell from 93% to 67% (see Limits). At 784 sessions, RoCE served 74,427 input tokens per second, 5.7x TCP.
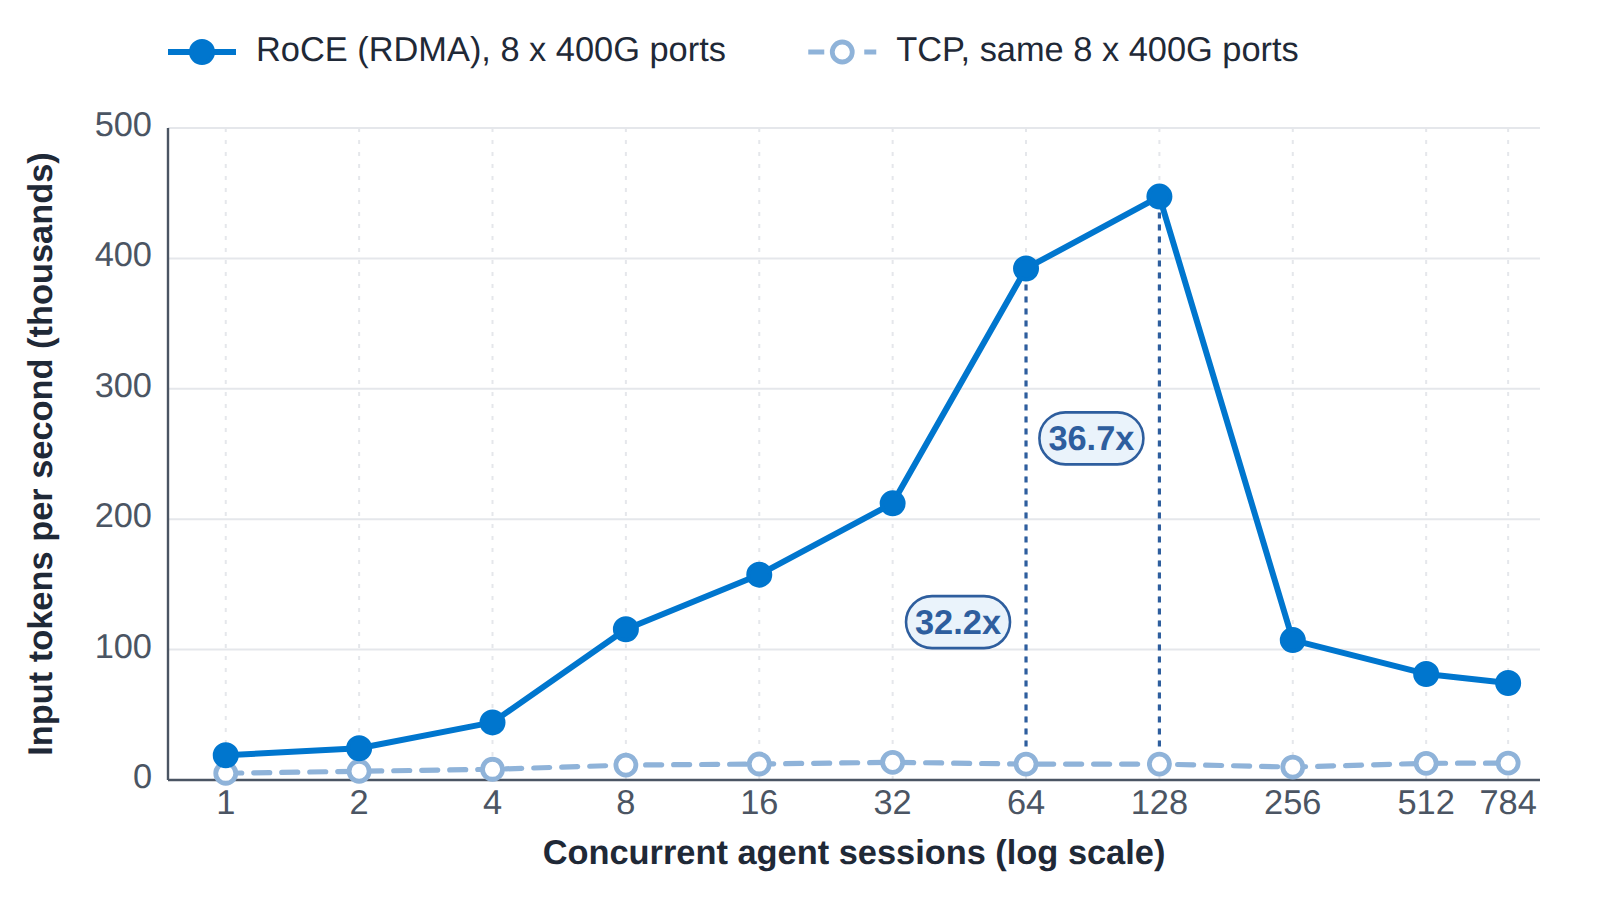
Figure 4 | RoCE throughput rose with concurrency up to 128 sessions, while TCP stayed between 9,903 and 13,560 input tokens per second from 8 sessions up. At 256 sessions the RoCE prefix-cache hit rate fell from 93% to 67%.
Median time to first token over RoCE stayed under 0.5 s from 1 to 32 sessions, and was 1.09 s at 64 sessions and 3.27 s at 128. Over TCP it was 3.74 s at 1 session, 49.2 s at 32, 78.6 s at 64, and 170 s at 128. One KV transfer over TCP took 3.1 s even with a single session, and at higher load each request also waited behind other transfers.
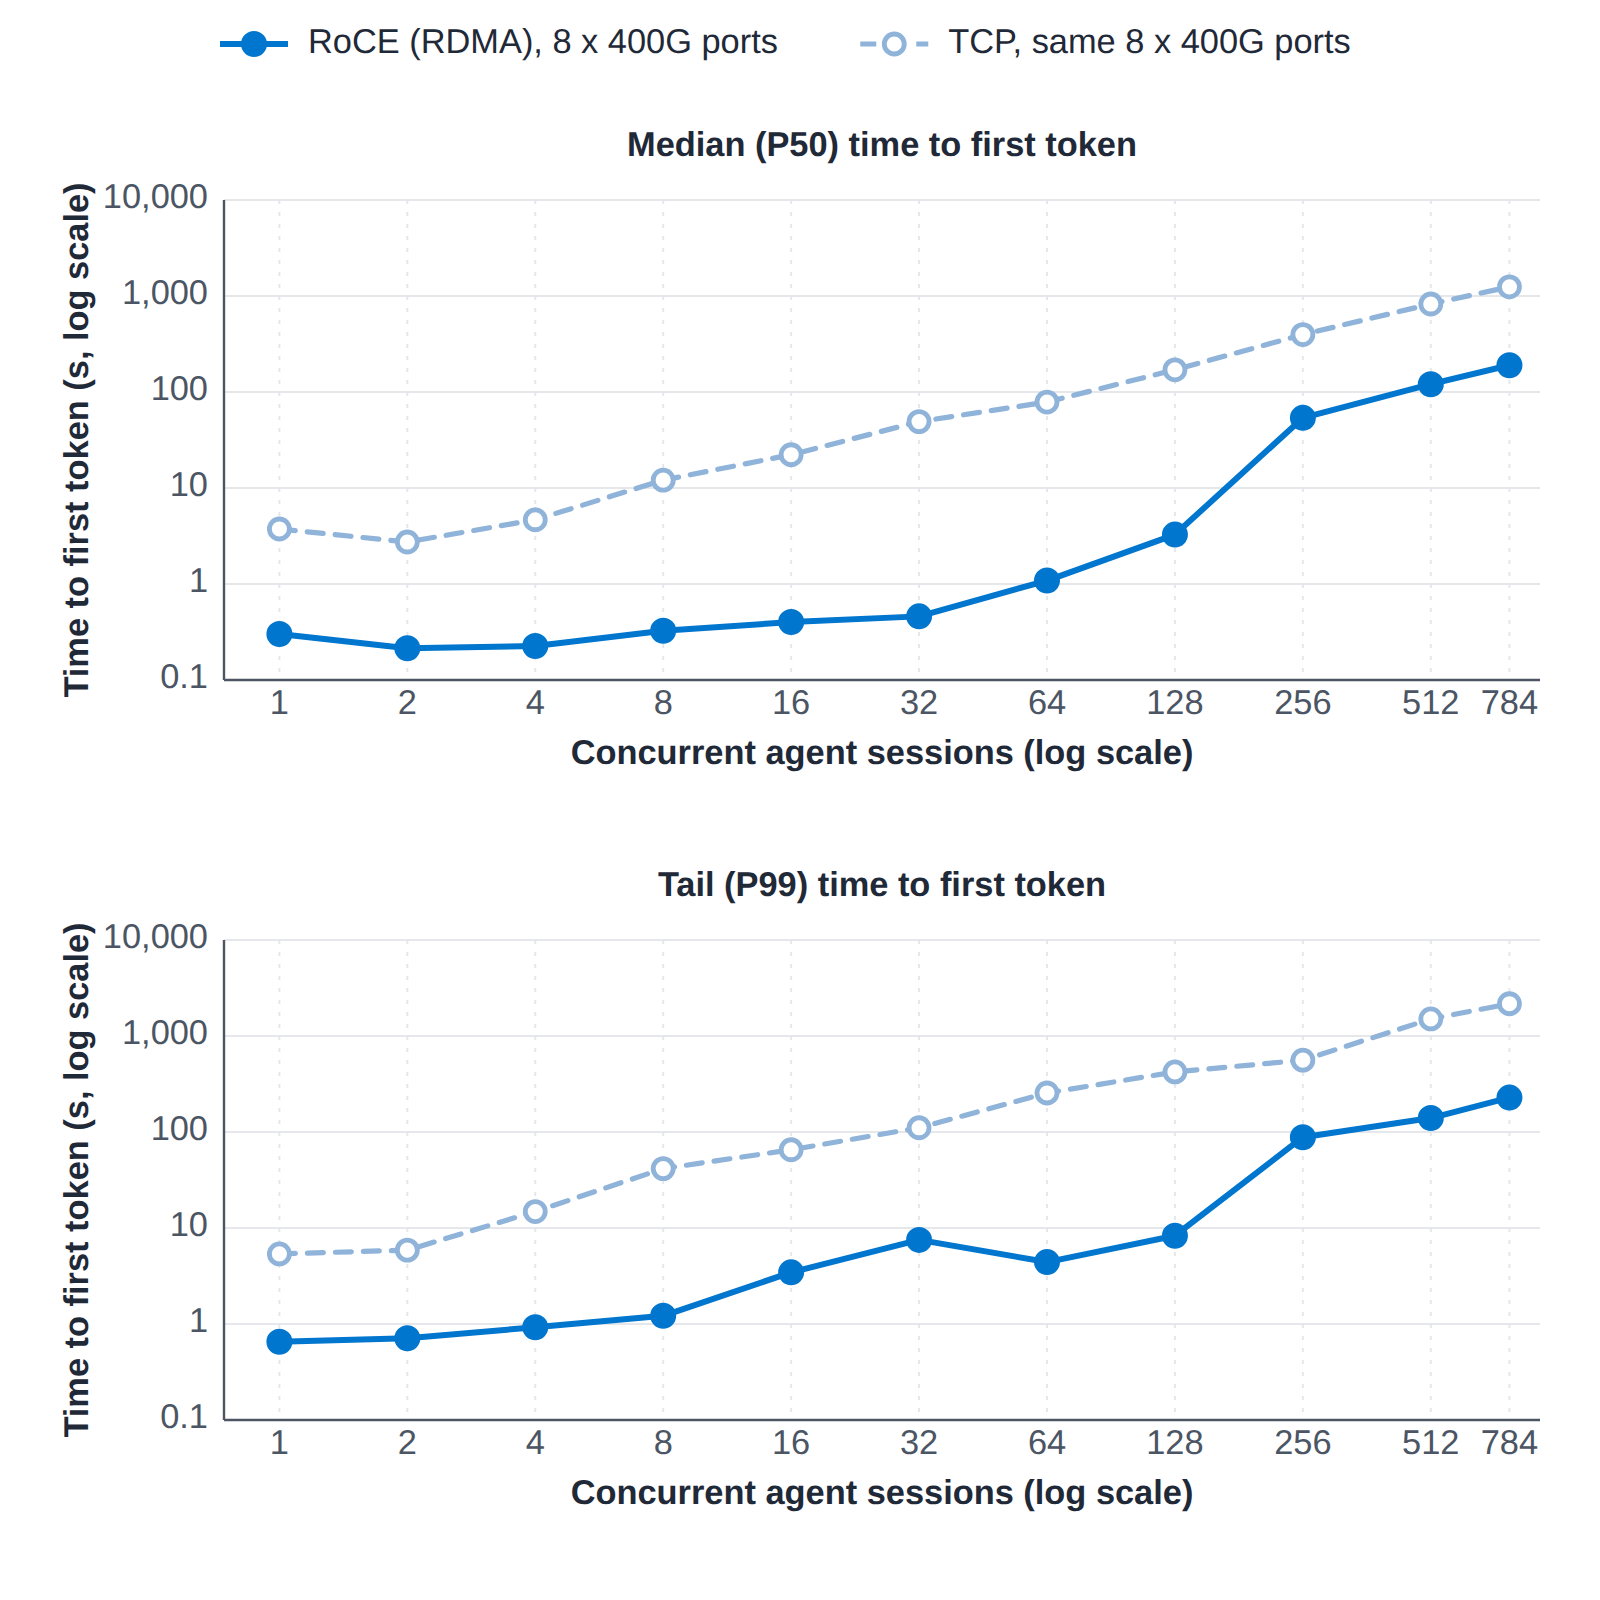
Figure 5 | Median and tail time to first token over RoCE and TCP, by number of concurrent sessions.
Input throughput and time to first token
Sessions | RoCE input tokens per second | TCP input tokens per second | RoCE lead | RoCE TTFT P50 (s) | TCP TTFT P50 (s) | RoCE TTFT P99 (s) | TCP TTFT P99 (s) |
1 | 19,003 | 5,173 | 3.7x | 0.30 | 3.74 | 0.65 | 5.37 |
2 | 24,362 | 6,714 | 3.6x | 0.21 | 2.74 | 0.71 | 5.88 |
4 | 44,170 | 8,228 | 5.4x | 0.23 | 4.67 | 0.93 | 14.8 |
8 | 115,639 | 11,431 | 10.1x | 0.33 | 12.1 | 1.22 | 41.5 |
16 | 157,465 | 12,263 | 12.8x | 0.40 | 22.2 | 3.45 | 65.3 |
32 | 212,166 | 13,560 | 15.6x | 0.46 | 49.2 | 7.51 | 111 |
64 | 392,271 | 12,198 | 32.2x | 1.09 | 78.6 | 4.42 | 255 |
128 | 447,416 | 12,190 | 36.7x | 3.27 | 170 | 8.31 | 422 |
256 | 107,304 | 9,903 | 10.8x | 53.8 | 397 | 88.2 | 560 |
512 | 81,315 | 12,800 | 6.4x | 121 | 825 | 140 | 1,506 |
784 | 74,427 | 13,002 | 5.7x | 190 | 1,246 | 228 | 2,168 |
Table 7 | Input throughput and time to first token, 1 to 784 sessions. Higher input throughput and lower TTFT are better.
At 128 sessions, RoCE completed 19.4 requests per second, and TCP 0.58, 33 times as many.
Each request carried a comparable KV cache on both transports: 5.8 GB over RoCE and 5.3 GB over TCP at 128 sessions, for 22,877 and 20,927 prompt tokens on average. Averaged over the load window, RoCE traffic on the prefill node's eight ports was 929 Gb/s, 29% of their 3,200 Gb/s line rate. TCP traffic was 27 Gb/s, 0.9% of the line rate. Neither transport approached the port rate, so port bandwidth did not limit throughput. A RoCE handoff of 5.8 GB took 77 ms on average against a 30 ms floor for 4 rails at line rate. A TCP handoff took 140 s on average at the same load, most of it waiting behind other transfers.
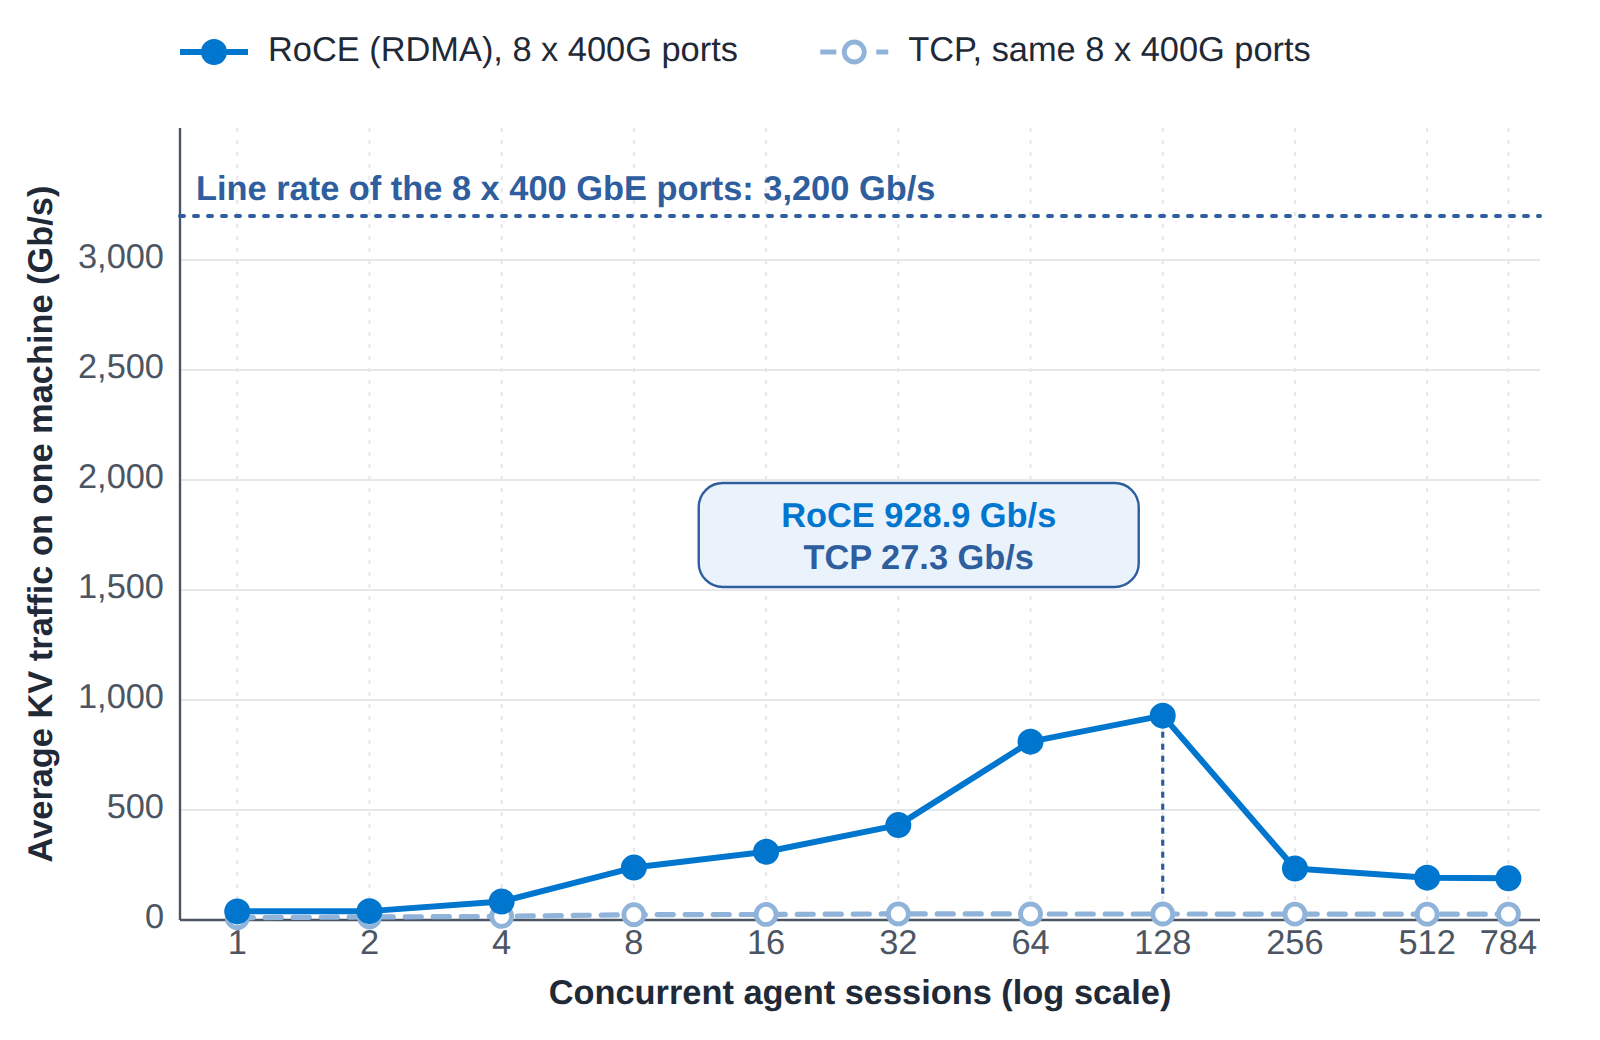
Figure 6 | Average KV traffic on one node's eight ports over the load window. The eight ports have a combined line rate of 3,200 Gb/s.
KV volume and traffic
Sessions | Prompt tokens per request | KV per request (GB) | RoCE prefix-cache hit rate | RoCE KV traffic (Gb/s) | TCP KV traffic (Gb/s) |
1 | 24,163 / 22,951 | 6.14 / 5.83 | 94% | 39 | 11 |
2 | 14,988 / 14,988 | 3.81 / 3.81 | 88% | 40 | 14 |
4 | 16,888 / 16,888 | 4.29 / 4.29 | 90% | 84 | 17 |
8 | 21,650 / 24,784 | 5.50 / 6.30 | 94% | 238 | 24 |
16 | 23,791 / 23,791 | 6.04 / 6.04 | 94% | 310 | 25 |
32 | 23,842 / 23,842 | 6.06 / 6.06 | 94% | 431 | 28 |
64 | 22,596 / 21,202 | 5.74 / 5.39 | 94% | 811 | 27 |
128 | 22,877 / 20,927 | 5.81 / 5.32 | 93% | 929 | 27 |
256 | 21,886 / 21,120 | 5.56 / 5.37 | 67% | 234 | 27 |
512 | 22,212 / 21,648 | 5.64 / 5.50 | 55% | 192 | 26 |
784 | 22,826 / 22,047 | 5.80 / 5.60 | 55% | 189 | 27 |
Table 8 | KV volume and traffic, 1 to 784 sessions. Prompt tokens and KV are per request, RoCE / TCP, averaged over every request the simulated users sent, including warm-up. Hit rate is the share of prompt tokens the RoCE prefill engines found in their prefix cache. Traffic is what the prefill node's eight ports sent over the load window, and for RoCE it included the KV of requests in flight at the window edges.
The NIC retransmission, out-of-sequence, ACK timeout, and RoCE discard counters read zero in every RoCE run, so no RoCE packet was lost. A lost packet always shows up as an out-of-sequence packet or a retransmission. Wherever the switch was read, its counters also recorded no dropped packets on any of the 16 ports.
Limits
- TCP on the tested stack has no path into GPU memory. vLLM 0.32.0 moves the KV cache through NIXL over UCX on Linux 6.8. UCX has no TCP path into device memory, so TCP copies the KV cache through host memory. Both runs moved the KV cache in vLLM's 16 KiB blocks per layer, about 325,000 for a request of 21,000 tokens. An iperf3 link test before each TCP run measured 178 to 208 Gb/s on one port, so the link did not limit TCP.
- RoCE held 1,995,648 tokens of KV cache per node against 3,638,304 for TCP. Because of a current ROCm driver limit on GPU memory pinned for RDMA, the RoCE engines used a KV cache of half the free GPU memory. TCP does not pin GPU memory and used vLLM's default sizing. From 8 to 128 sessions, the RoCE prefix-cache hit rate stayed at 93 to 94%. From 256 sessions, it fell to 67% and then 55%. The engines recomputed more of each prompt, and throughput fell from its peak.
Scope and next steps
This paper measures the KV transport under one disaggregated layout, on one pair of nodes, with one model and one dataset. It does not size a cluster or compare vendors. Further work will cover both transports on the same KV memory setting, and layouts with more decode engines per prefill engine and more nodes.
Appendix: data
Table 9 lists the runs behind every figure in this paper.
Run inventory
Transport | Valid runs | Requests | Failed requests |
RoCE | 19 of 19 | 72,129 | 0 |
TCP | 17 of 17 | 18,674 | 0 |
Table 9 | Runs in the test series.
References
| 1. | Zhong et al. DistServe: Disaggregating Prefill and Decoding for Goodput-optimized Large Language Model Serving. OSDI 2024. https://arxiv.org/abs/2401.09670 |
| 2. | NVIDIA Inference Xfer Library (NIXL), which uses Unified Communication X (UCX) as its transport library. https://github.com/ai-dynamo/nixl |
| 3. | vLLM. Open-source LLM inference and serving engine, version 0.32.0. https://github.com/vllm-project/vllm |
| 4. | LMCache agentic-traces dataset (CC BY 4.0). Coding-agent sessions, mostly from SWE-bench, used as the workload. https://huggingface.co/datasets/sammshen/lmcache-agentic-traces |
| 5. | SWE-bench (MIT License). Source of the coding tasks in the agentic traces. https://www.swebench.com |
| 6. | MiniMax-M2.7 model card, MiniMaxAI. https://huggingface.co/MiniMaxAI/MiniMax-M2.7 |
| 7. | Zhu et al. Congestion Control for Large-Scale RDMA Deployments (DCQCN). ACM SIGCOMM 2015. https://doi.org/10.1145/2785956.2787484 |
| 8. | IEEE 802.1Qbb. Priority-based Flow Control. IEEE Standards Association. https://standards.ieee.org/ieee/802.1Qbb/4361/ |
| 9. | InfiniBand Trade Association. Annex A17: RoCEv2. https://www.infinibandta.org/ibta-specification/ |
| 10. | Unified Communication X (UCX). Frequently asked questions. https://openucx.readthedocs.io/en/master/faq.html |
| 11. | Dell PowerEdge XE9680 spec sheet. Dell Technologies. https://www.delltechnologies.com/asset/en-ca/products/servers/technical-support/poweredge-xe9680-spec-sheet.pdf |
| 12. | Dell PowerSwitch Z9864F-ON spec sheet. Dell Technologies. https://www.delltechnologies.com/asset/en-us/products/networking/technical-support/dell-powerswitch-z9864f-on-spec-sheet.pdf |
| 13. | Broadcom BCM57608 product brief. Broadcom. https://docs.broadcom.com/doc/BCM57608-PB |
| 14. | AMD Instinct MI300X accelerator. AMD. https://www.amd.com/en/products/accelerators/instinct/mi300/mi300x.html |
Product specifications come from the Dell, AMD, and Broadcom documentation listed in the references. Product images courtesy of Dell Technologies and Broadcom.
Broadcom, the pulse logo, Thor, and Tomahawk are among the trademarks of Broadcom Inc. and/or its affiliates in the United States, certain other countries, and/or the EU. Dell, Dell Technologies, PowerEdge, and PowerSwitch are trademarks of Dell Inc. or its subsidiaries. AMD, AMD CDNA, AMD Infinity Fabric, AMD Instinct, ROCm, and combinations thereof are trademarks of Advanced Micro Devices, Inc. Intel and Xeon are trademarks of Intel Corporation or its subsidiaries. Other product and company names used in this publication are for identification purposes only and may be trademarks of their respective owners.
Copyright © 2026 Metrum AI, Inc. All Rights Reserved.
DISCLAIMER: Testing was performed by Metrum AI in collaboration with Dell Technologies and Broadcom. All performance figures represent measurements that Metrum AI observed under the described test conditions. The tests used Dell PowerEdge XE9680 servers with AMD Instinct MI300X GPUs, Broadcom BCM57608 400 GbE NICs, and a Dell PowerSwitch Z9864F-ON. Results vary by model, hardware configuration, software version, network configuration, cache state, and deployment workload, so they are not guarantees of performance on different systems. The finding that disaggregated inference depends on a correctly configured RDMA fabric is the result that applies beyond this test. The Limits section lists the limits that apply to the figures in this paper.